Cardiovascular System Anatomy & Physiology PowerPoint Template

.avif)
No items found.
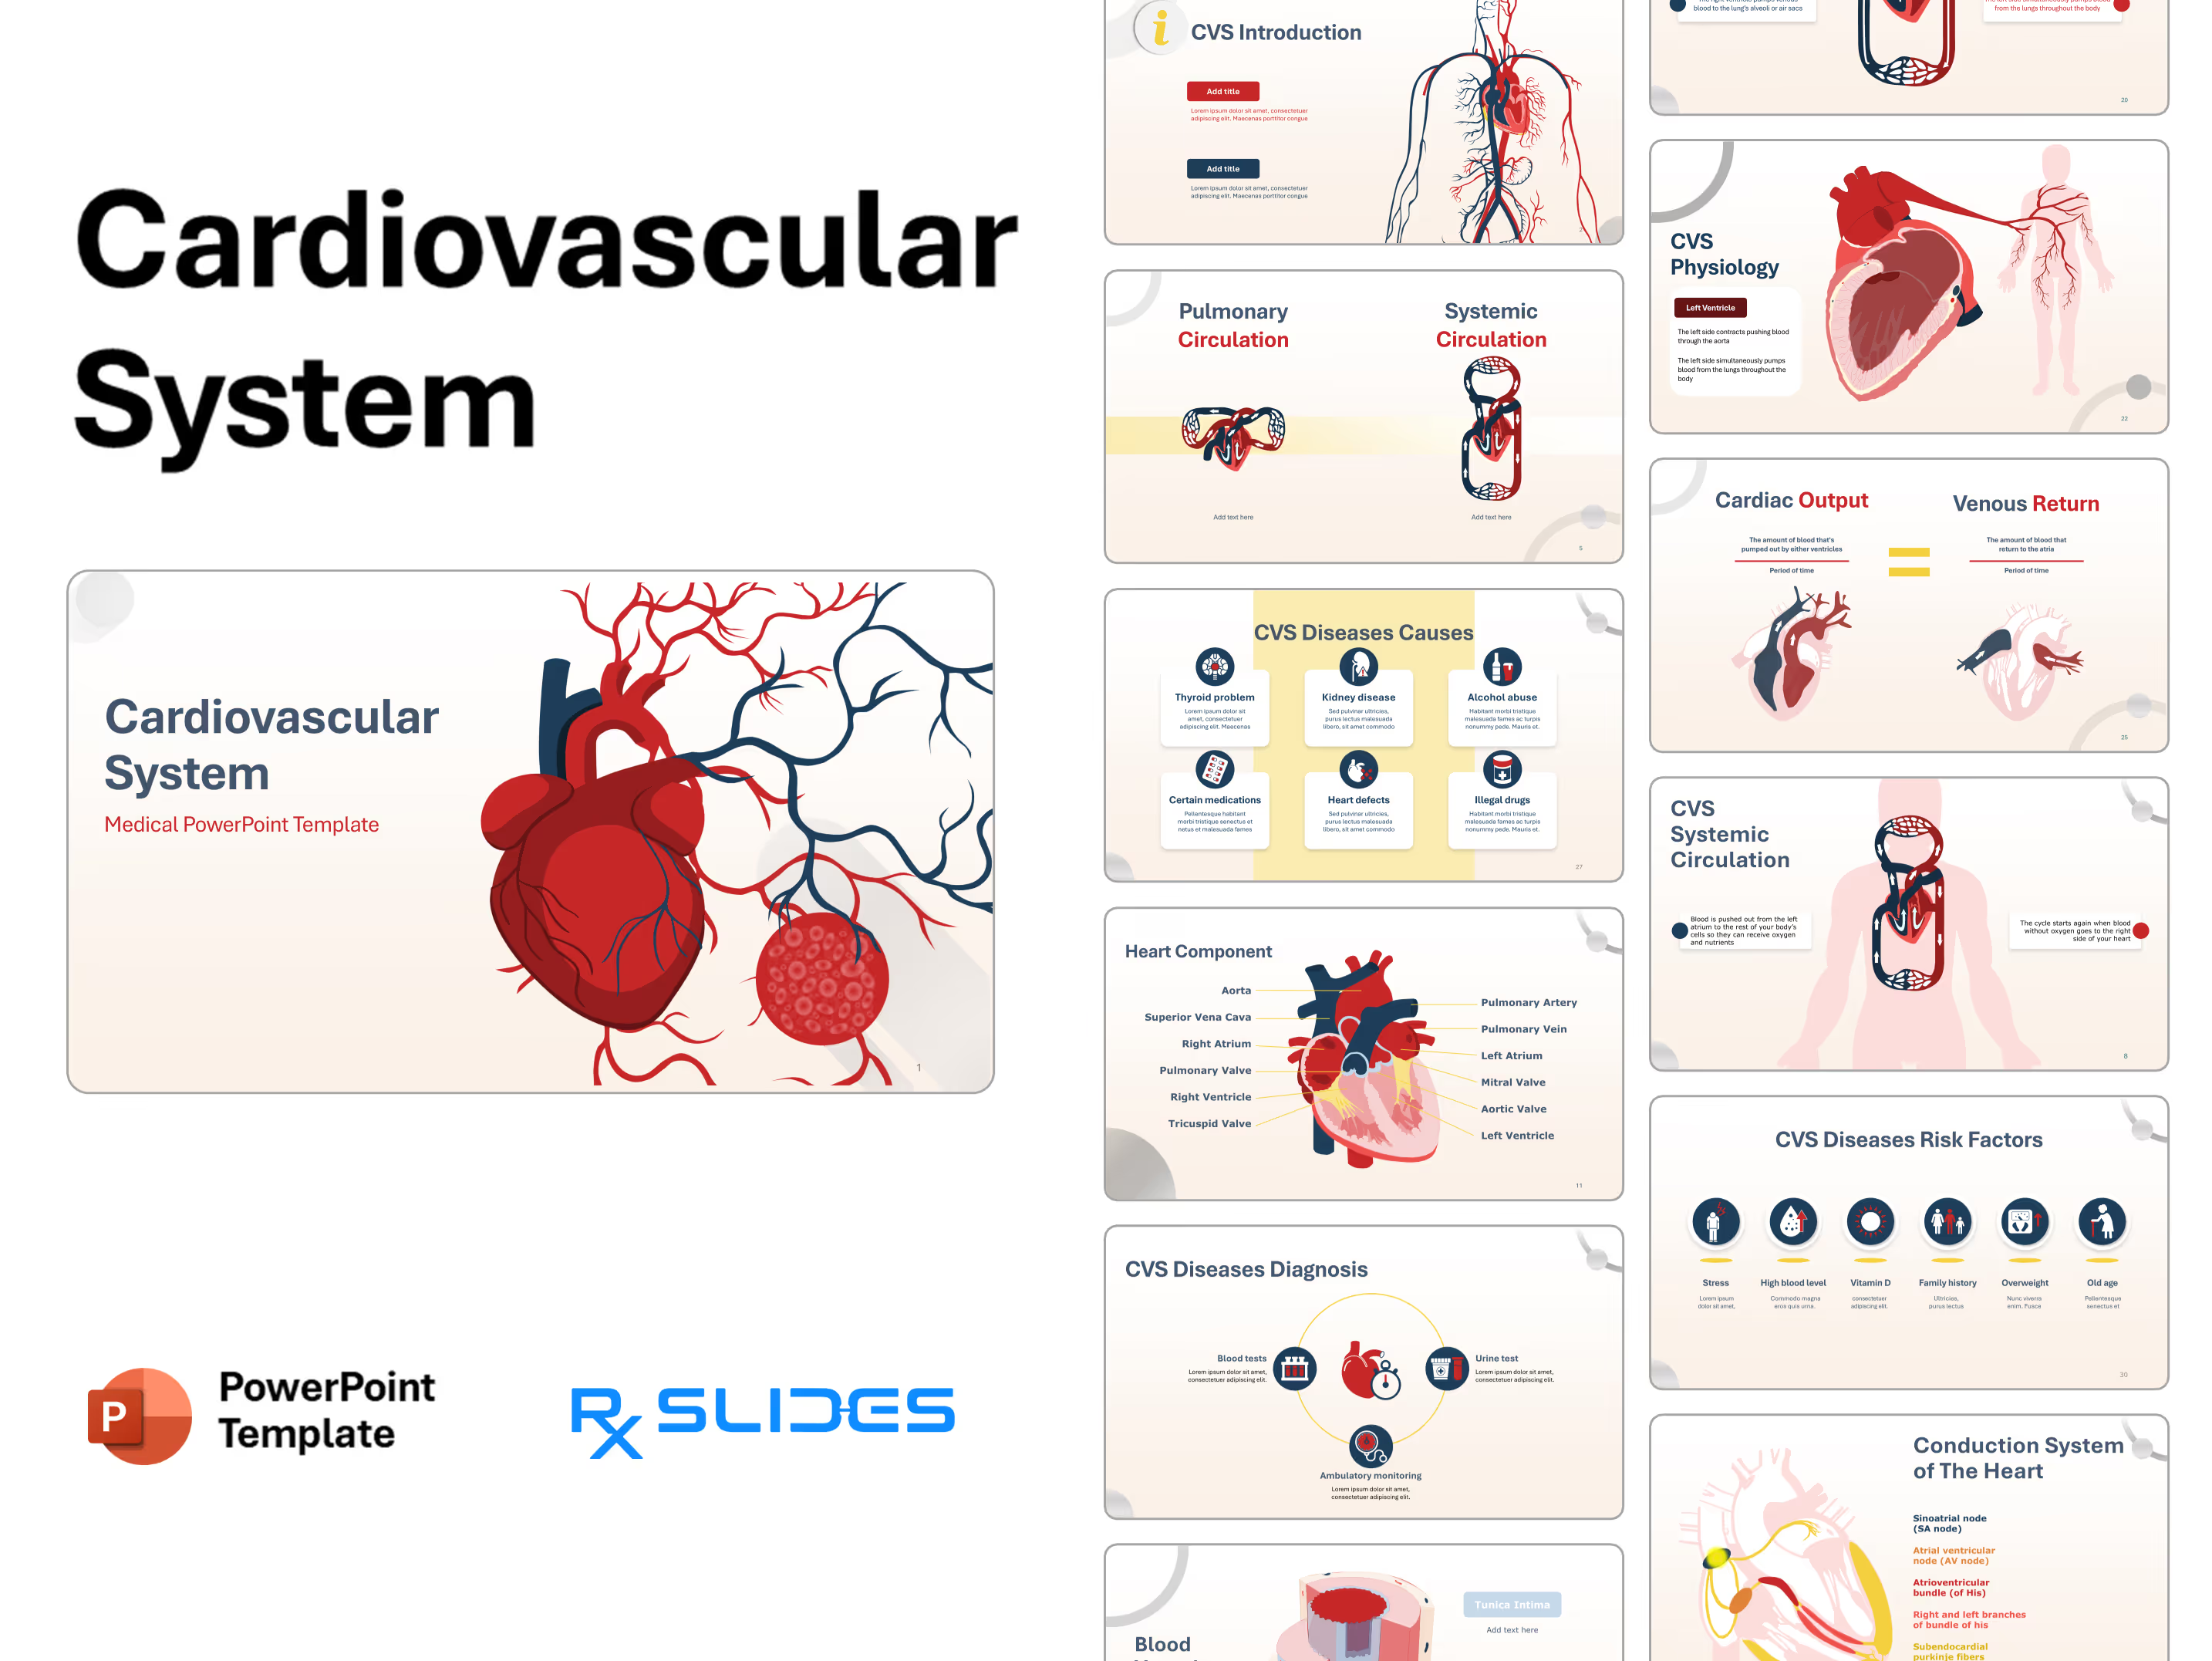
Cardiovascular System PowerPoint Template: 40 Medical Animated Slides
- The cardiovascular system PPT is a dynamic medical PowerPoint template created by RxSlides professionals that can enhance the effectiveness of your presentation.
- By using visual aids, a more engaging and informative description of the cardiovascular system can be presented, facilitating enhanced comprehension and retention of the subject matter.
- you can explore more related PPT such as the atherosclerosis PowerPoint template.
- Discover our premium Cardiac PowerPoint Templates, which feature innovative design features and a wide range of animated illustrations that demonstrate the pathophysiology of various heart disorders to instantly elevate your presentations to a professional level.
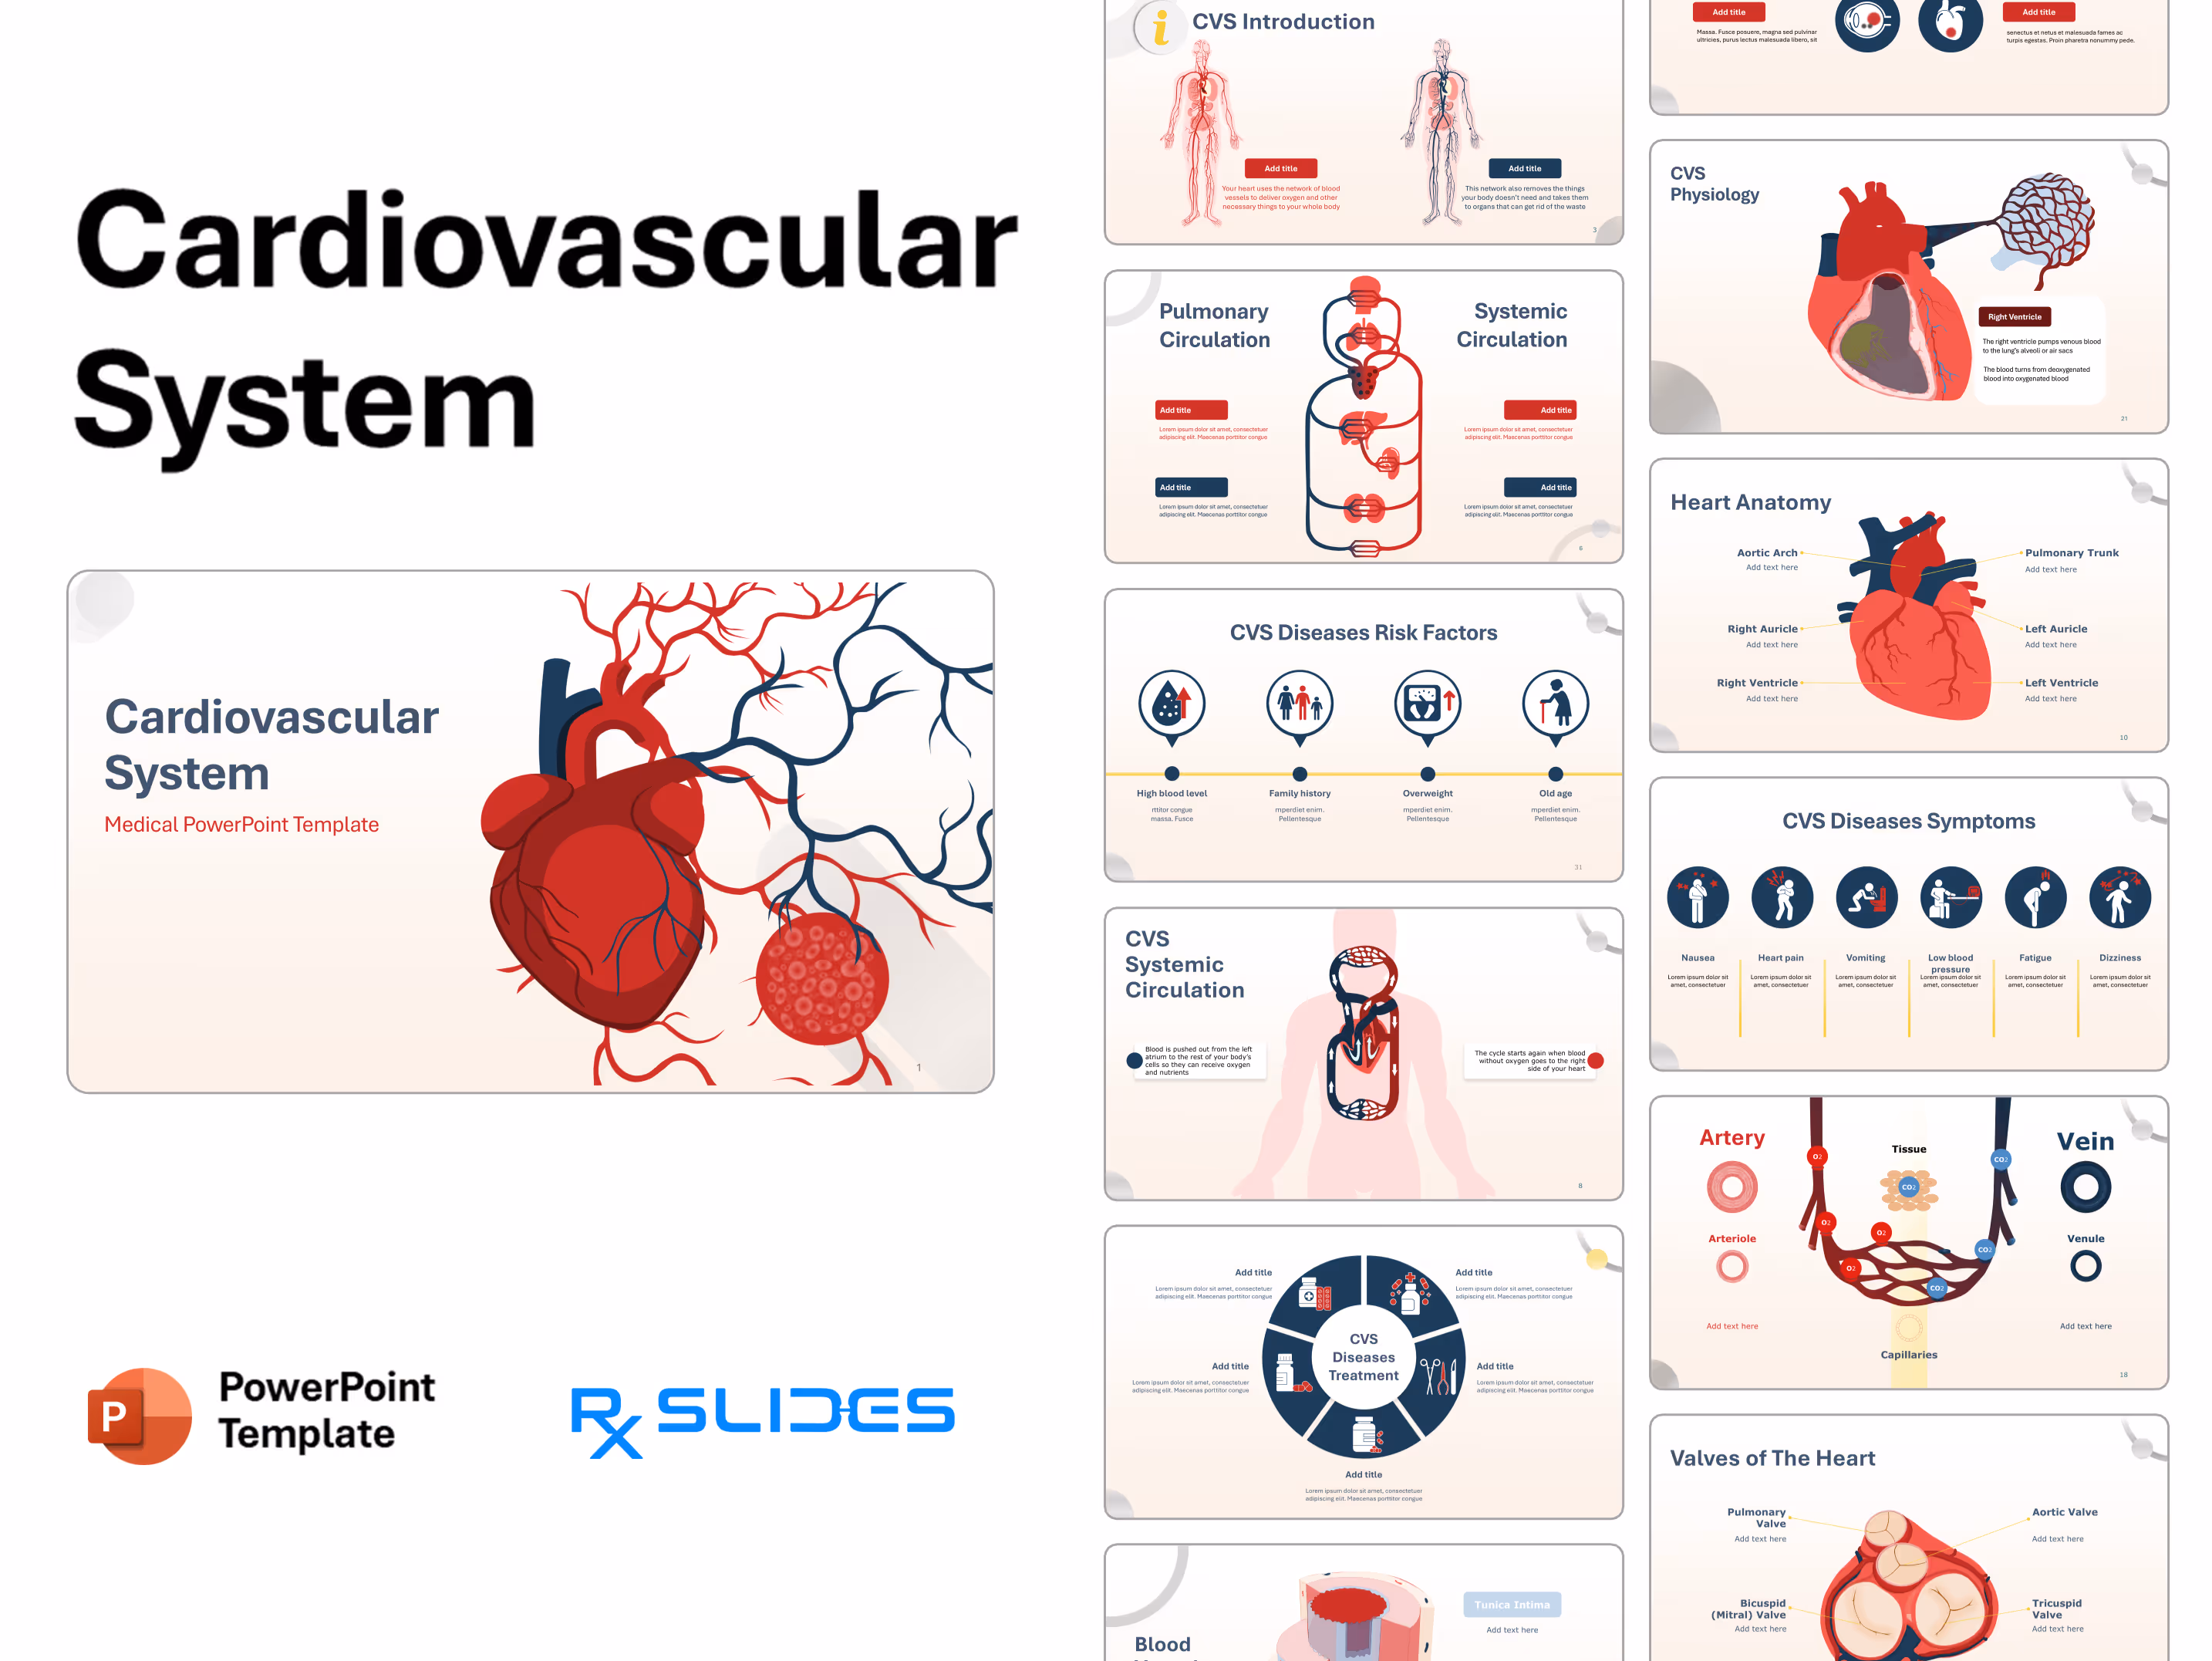
Cardiovascular System PowerPoint Template Preview
Cardiovascular System PowerPoint Template Content
Slide 1 - Title Slide
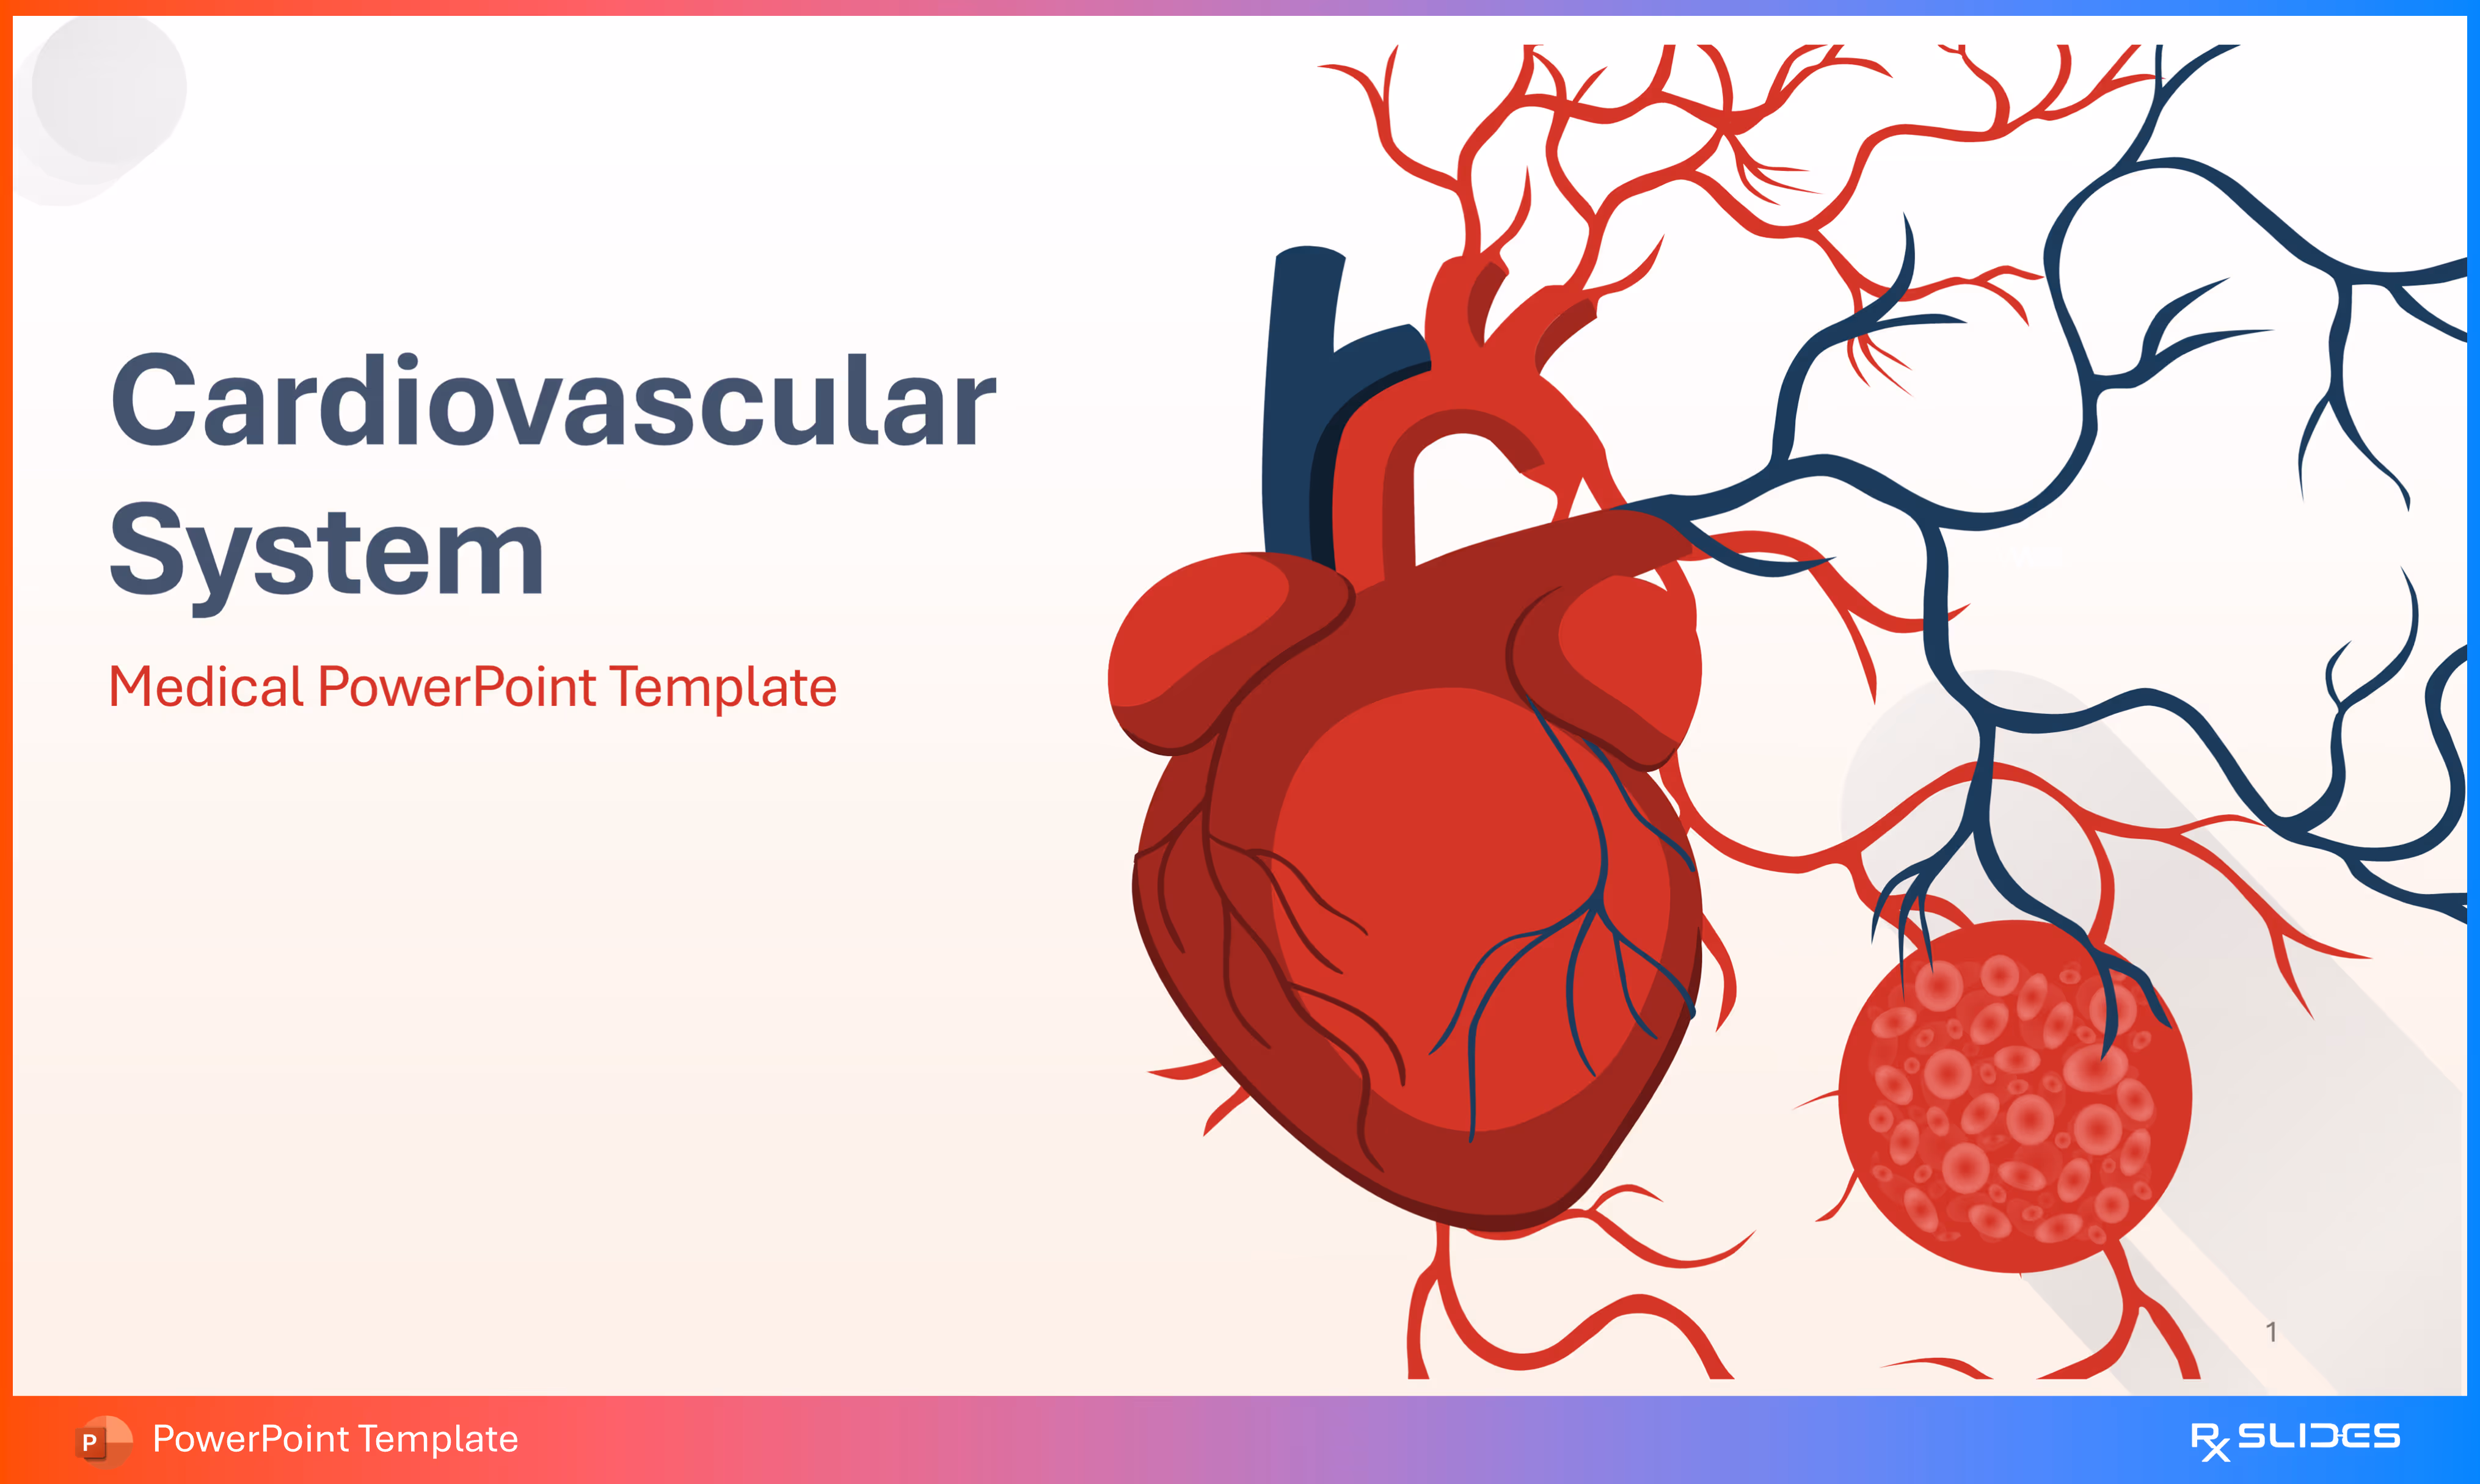
- The slide features a large, stylized red heart with branching red and dark blue vessels extending from it.
- There is also a small circular graphic showing a microscopic view of blood cells.
- Aesthetics: The template uses a primary color palette of red, dark blue (almost navy), and white.
Slide 2 - Introduction (CVS Introduction)
.avif)
- The slide features a large, detailed illustration of the Cardiovascular System overlaying a human body.
- This illustration highlights the central heart and the widespread arteries (red) and veins (blue).
- wo placeholders are provided on the left for key introductory points:
- Add title (Red box).
- Add title (Blue box).
- The design uses a yellow information icon (i) and the template's primary colors of red and dark blue.
Slide 3 - CVS Introduction (Function Detail)
.avif)
- The slide uses two adjacent human body illustrations, separating the functions of the oxygenated (arteries) and deoxygenated (veins) blood flow.
- Content Sections (Functions):
- Red (Oxygenated) Side: The text describes the distribution function: "Your heart uses the network of blood vessels to deliver oxygen and other necessary things to your whole body".
- Blue (Deoxygenated) Side: The text describes the waste removal function: "This network also removes the things your body doesn't need and takes them to organs that can get rid of the waste".
- Visual Elements:
- The left figure is dominated by red vessels showing delivery.
- The right figure is dominated by dark blue vessels showing collection and removal.
Slide 4 - CVS Components
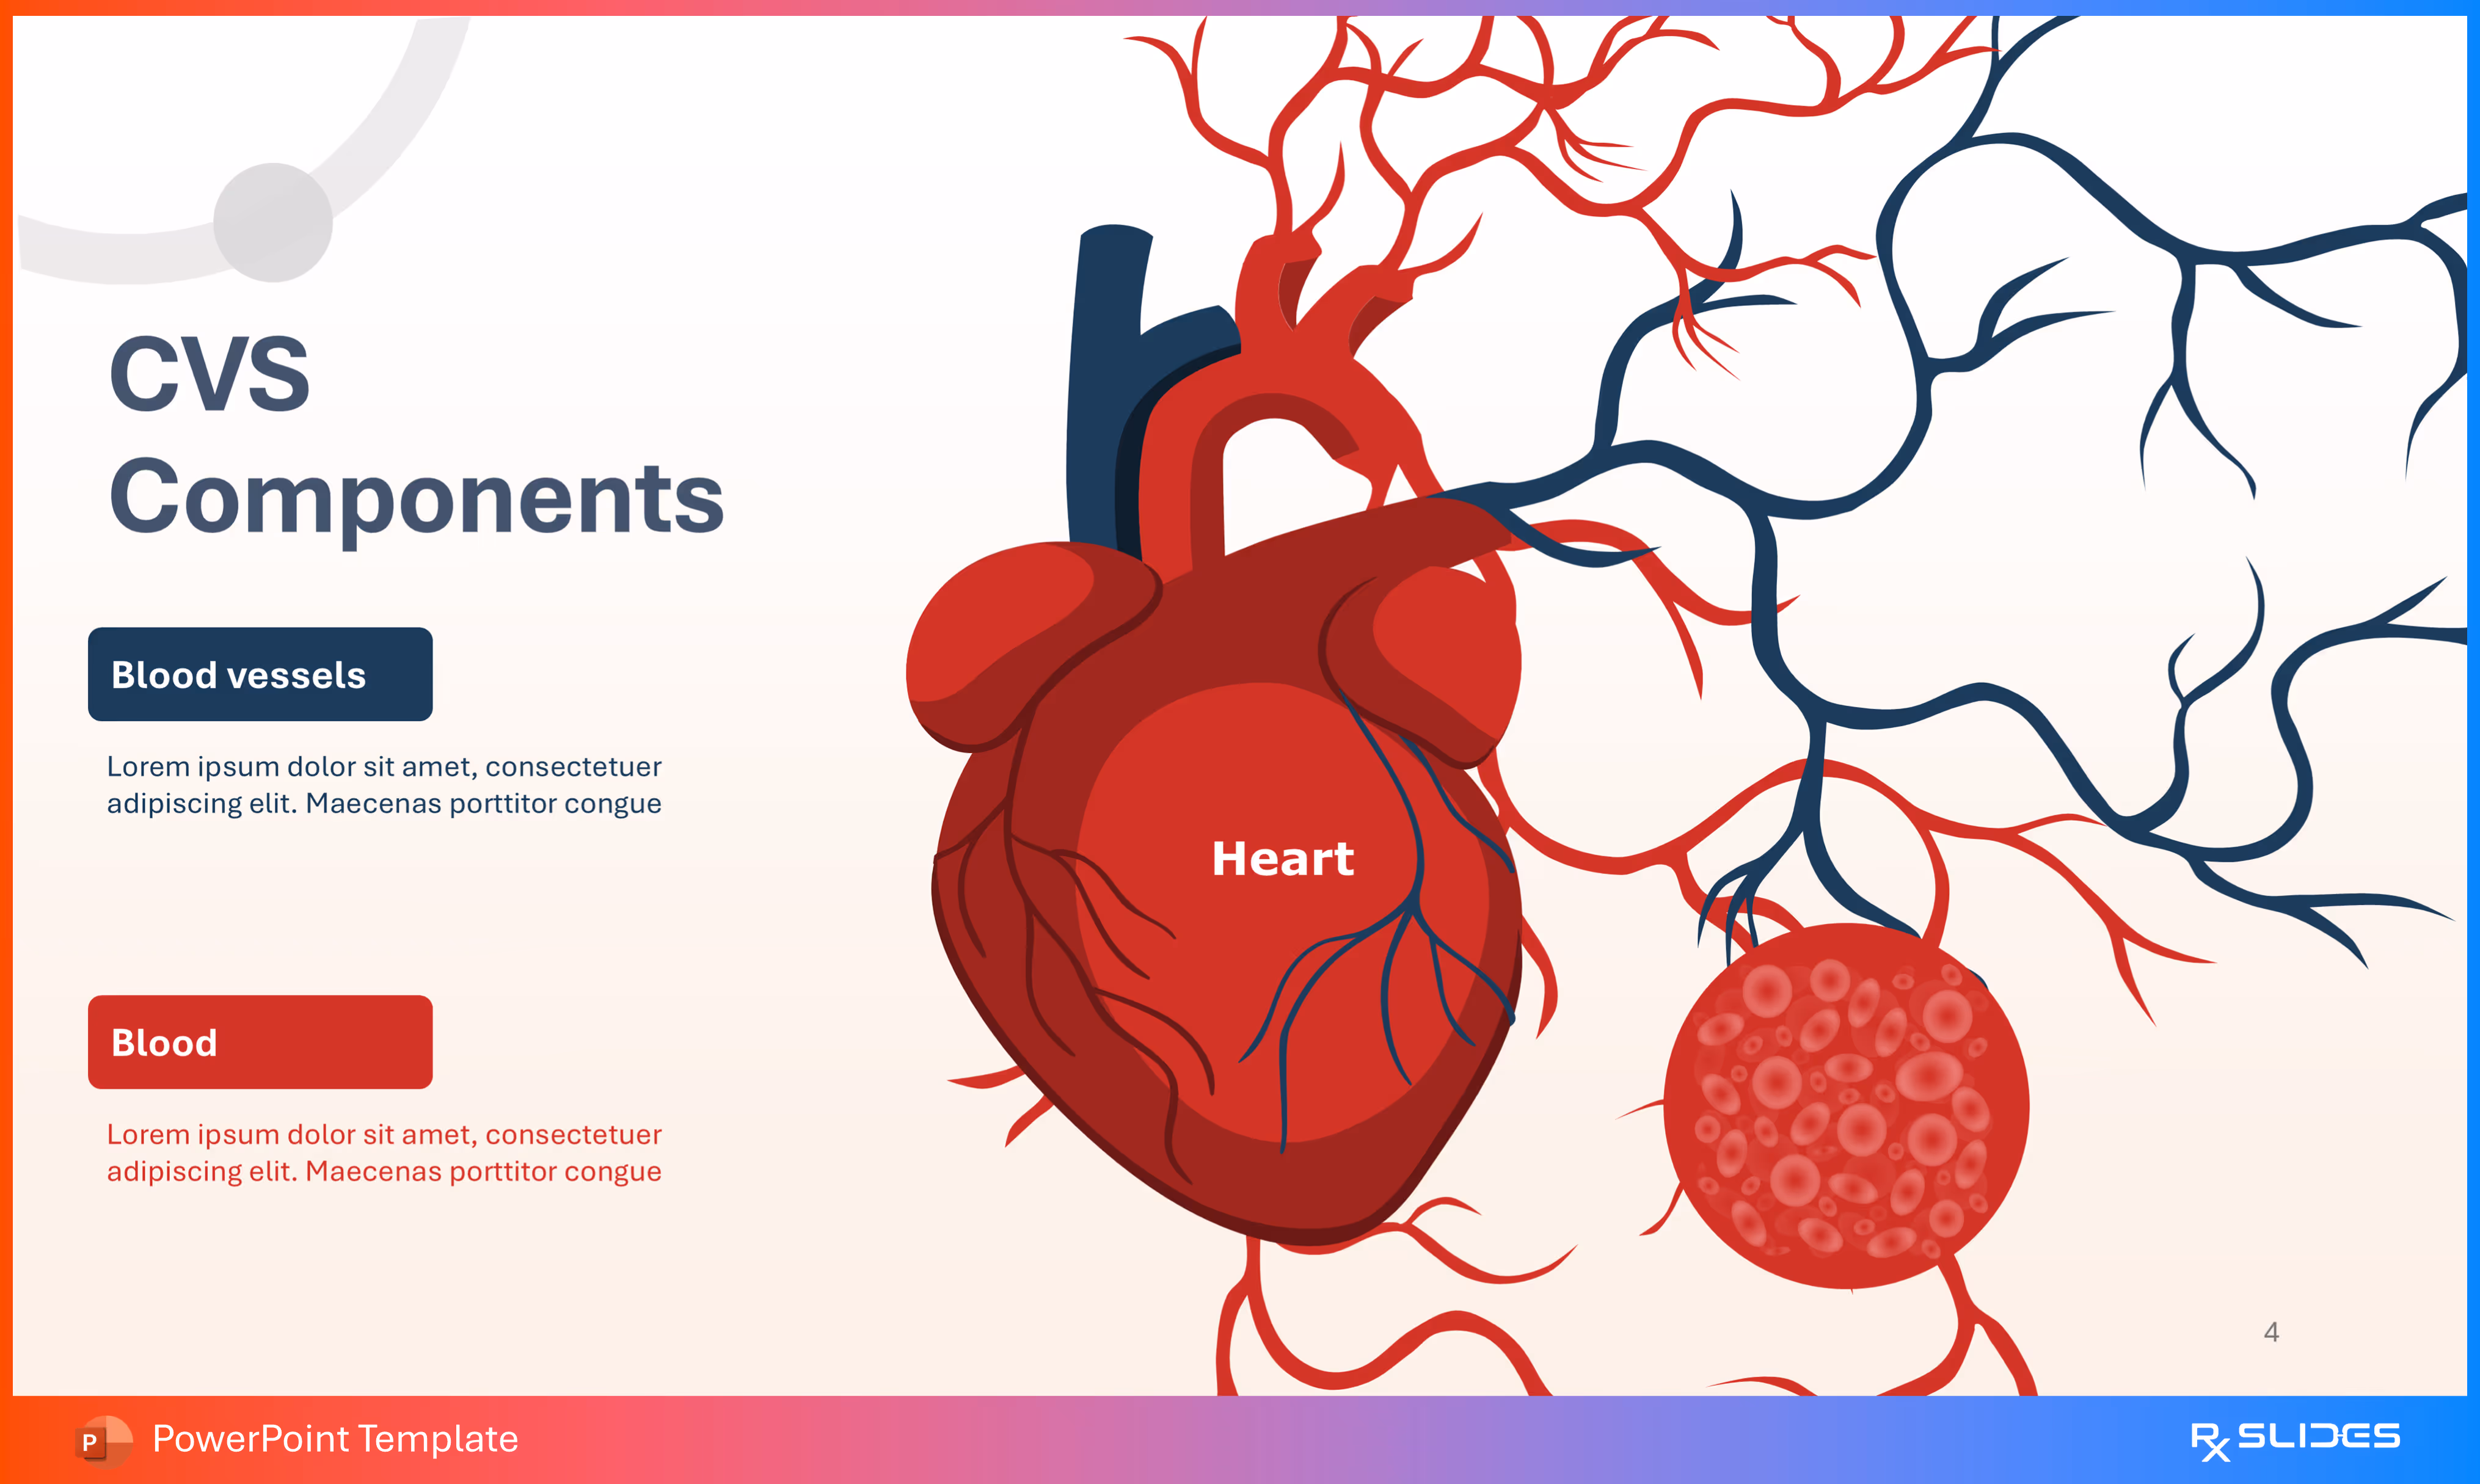
- The slide visually highlights the three main components that make up the Cardiovascular System, using a large central illustration.
- Content Sections (Components):
- Heart (Central Illustration): Clearly labeled at the center of the diagram.
- Blood vessels (Blue box): This element is featured with explanatory text below it.
- Blood (Red box): This element is featured with explanatory text below it.
- The right side is dominated by a detailed drawing of the heart and surrounding vasculature.
- A magnified circle showing blood cells represents the 'Blood' component.
Slide 5 - Pulmonary and Systemic Circulation
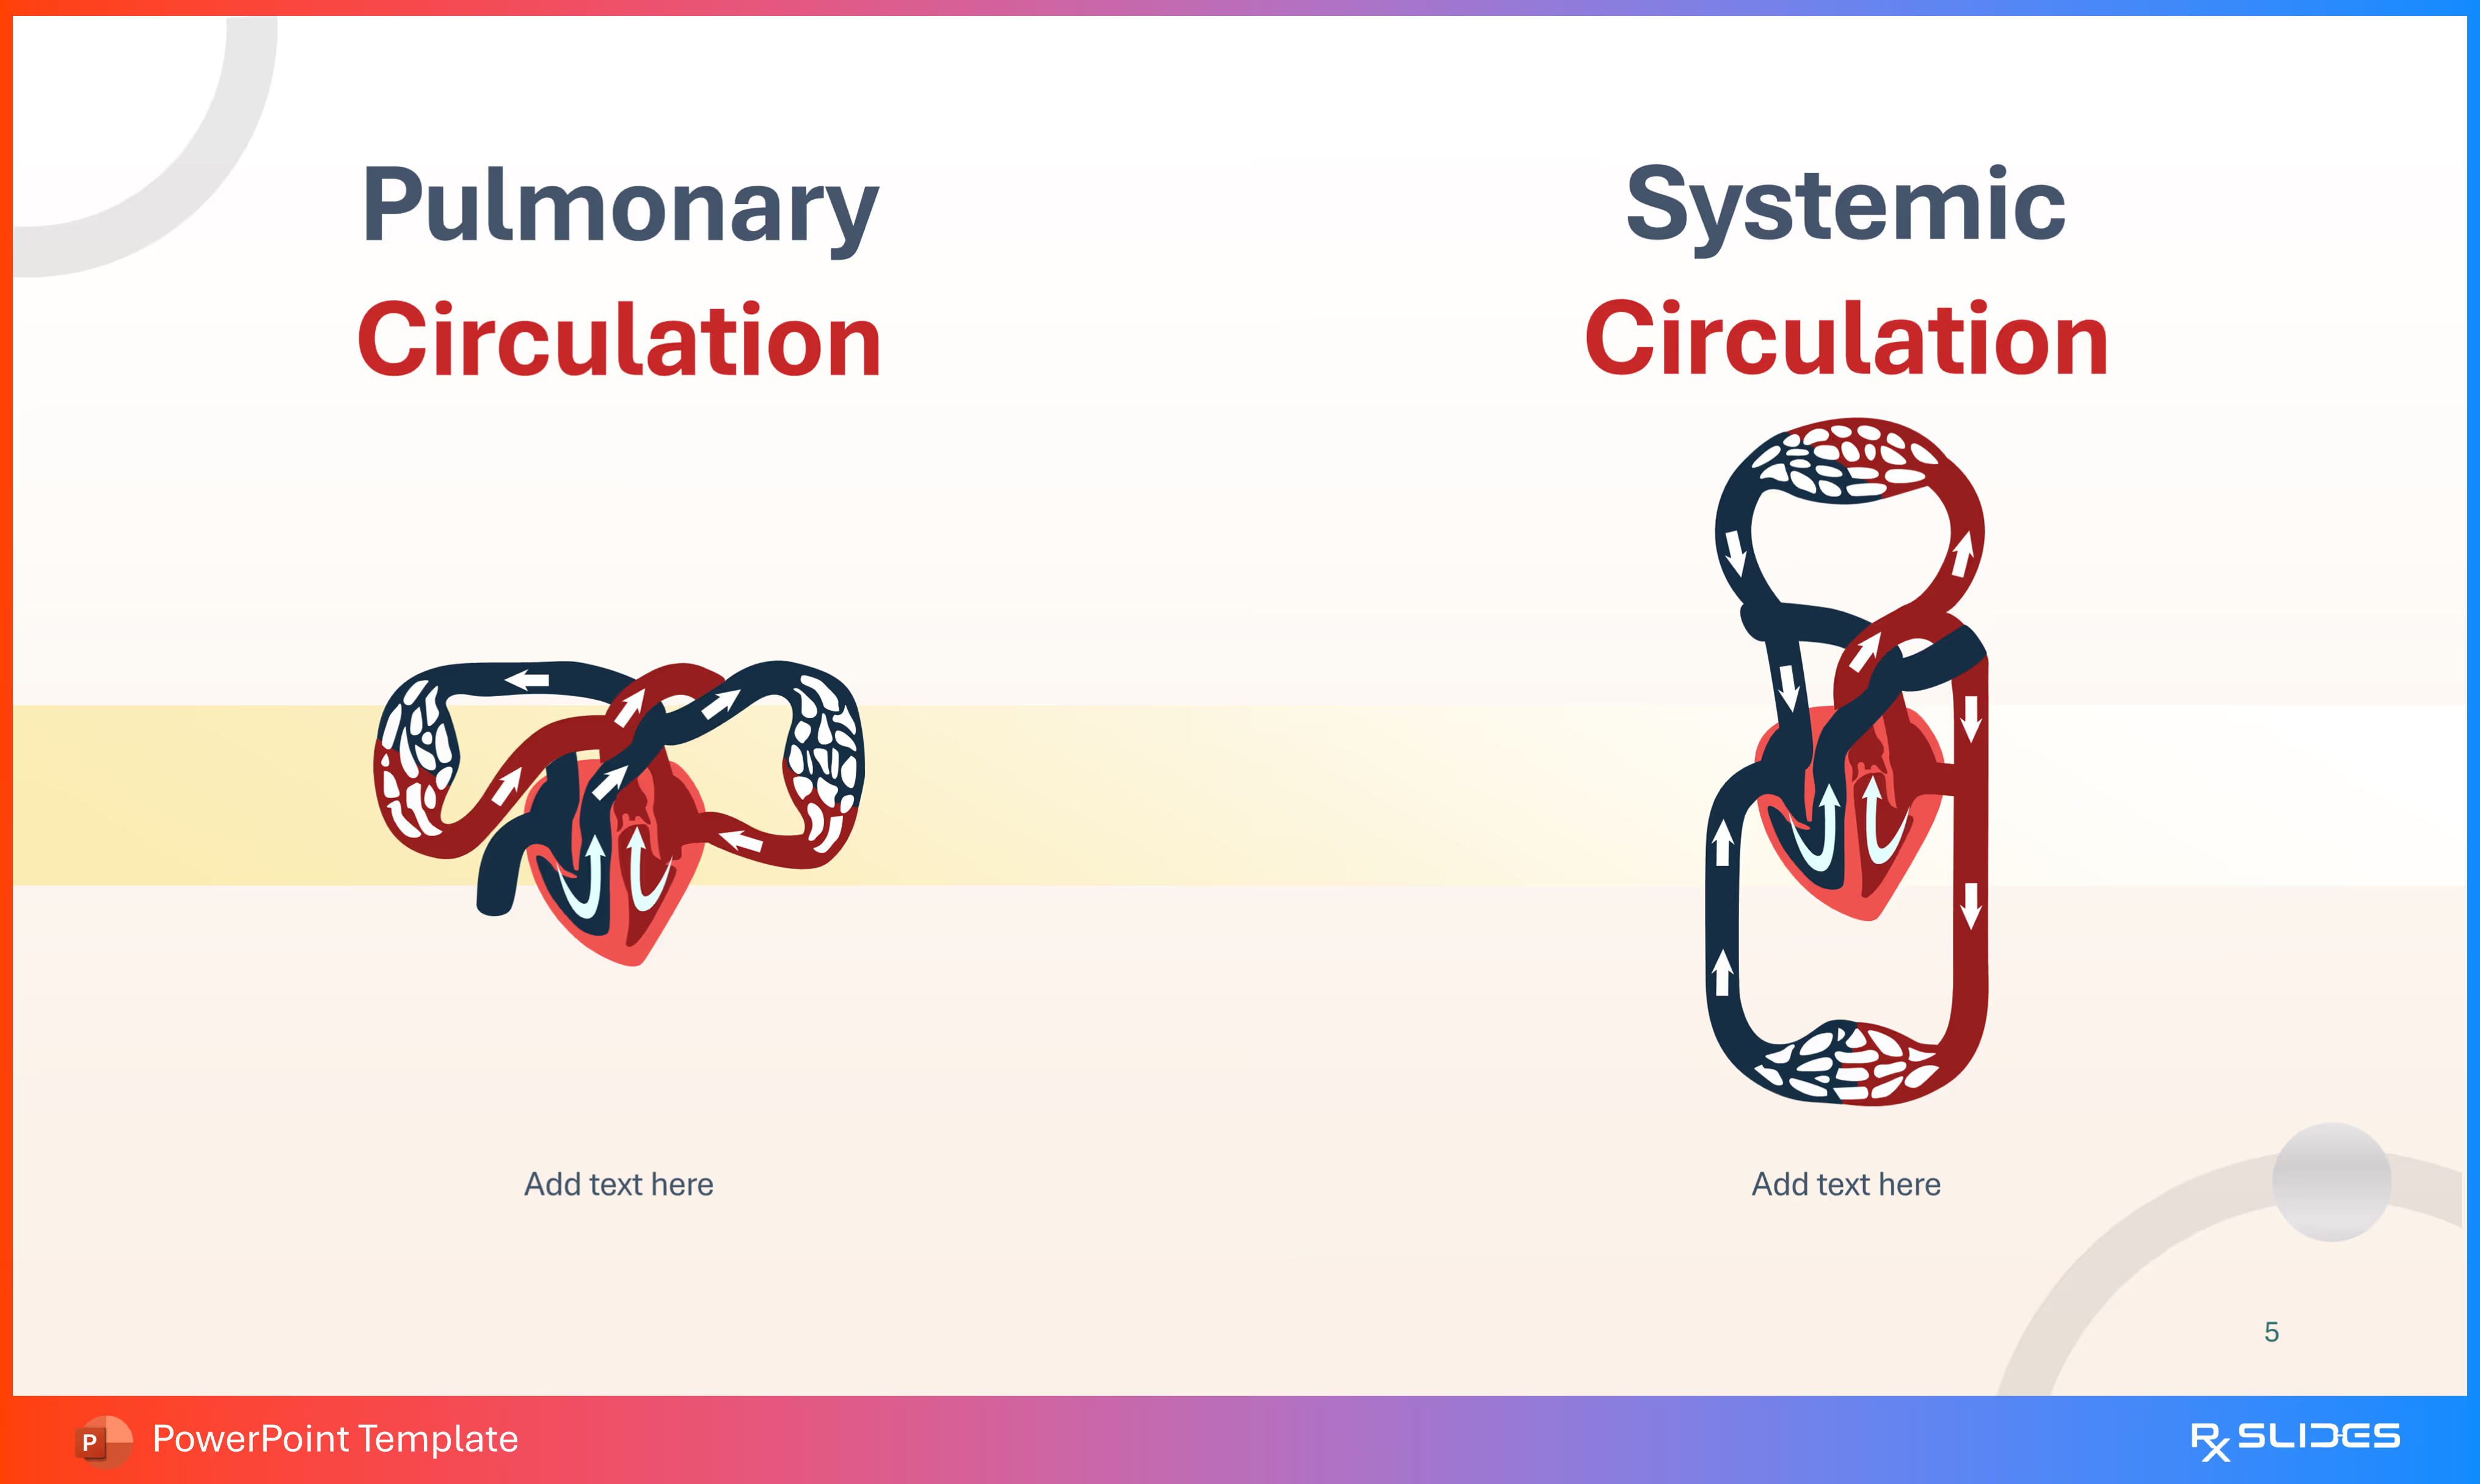
- This slide is split into two distinct sections, visually comparing the two circulation loops.
- Content Sections:
- Pulmonary Circulation: Illustrated with the heart and a small, concentrated loop of vessels. This is the circulation that moves blood between the heart and lungs.
- Systemic Circulation: Illustrated with a much larger loop representing the flow of blood to and from the rest of the body.
- Both diagrams use red to show oxygenated blood flow (arteries) and dark blue to show deoxygenated blood flow (veins), with arrows indicating direction.
Slide 6 - Pulmonary and Systemic Circulation (Organ Detail)
.avif)
- This slide uses a detailed central diagram of the circulation loops passing through a simplified human torso, with content boxes on the left and right.
- The central diagram clearly illustrates the path of blood, including key organs involved:
- The Heart.
- The Lungs (where Pulmonary Circulation occurs).
- Organs in the lower body, such as the Liver and others, representing the systemic circuit.
- Four placeholder boxes are provided (two red, two blue) for defining details about the circulation types.
Slide 7 - CVS Pulmonary Circulation (Detailed Function)
.avif)
- The slide focuses heavily on the heart and lungs, visually explaining the process of blood oxygenation.
- Visual Elements:
- The central illustration shows the heart and lungs with arrows indicating blood flow direction.
- Dark blue represents Deoxygenated Blood.
- Red represents Oxygenated Blood.
- Content Sections (Steps):
- Deoxygenated Blood (Red dot): "Blood without oxygen comes into the right side of your heart and is sent to the lungs to get oxygen and get rid of carbon dioxide".
- Oxygenated Blood (Blue dot): "Then the oxygenated blood comes back through the left side of your heart".
Slide 8 - CVS Systemic Circulation (Detailed Function)
.avif)
- Similar to Slide 7, this slide features a large central diagram showing the circulation loops, but the focus here is on the delivery and return of blood to the rest of the body.
- The central illustration shows the circulation extending out from the heart to the entire body outline.
- Content Sections (Steps):
- Delivery (Blue dot): "Blood is pushed out from the left atrium to the rest of your body's cells so they can receive oxygen and nutrients".
- Return (Red dot): "The cycle starts again when blood without oxygen goes to the right side of your heart".
Slide 9 - Heart Anatomy (Section Divider)
.avif)
- The slide features a prominent circular icon containing a stylized illustration of the human heart, showing its main chambers and vessels in red and dark blue.
- The design maintains the red, dark blue, and white color scheme of the template, indicating the start of a new, detailed section focused on the heart.
Slide 10 - Heart Anatomy (External)
.avif)
- The slide features a large, central illustration of the heart, clearly showing its main external structures and attached vessels.
- Labeled Structures: Six structures are pointed out with placeholder text for descriptions:
- Aortic Arch (Blue/Red vessel at the top).
- Pulmonary Trunk (Blue vessel at the top).
- Right Auricle (Upper right side).
- Left Auricle (Upper left side).
- Right Ventricle (Lower right side).
- Left Ventricle (Lower left side).
- The diagram uses the template's characteristic red for oxygenated and dark blue for deoxygenated structures.
Slide 11 - Heart Component (Internal Anatomy)
.avif)
- The slide features a large, detailed cross-section of the human heart, with many key internal and external structures labeled.
- Eleven structures are labeled with connector lines:
- Aorta.
- Superior Vena Cava.
- Right Atrium.
- Pulmonary Valve.
- Right Ventricle.
- Tricuspid Valve.
- Pulmonary Artery.
- Pulmonary Vein.
- Left Atrium.
- Mitral Valve.
- Aortic Valve.
- Left Ventricle.
- The isometric, cut-away style clearly shows the relationship between the chambers and valves.
Slide 12 - Valves of The Heart
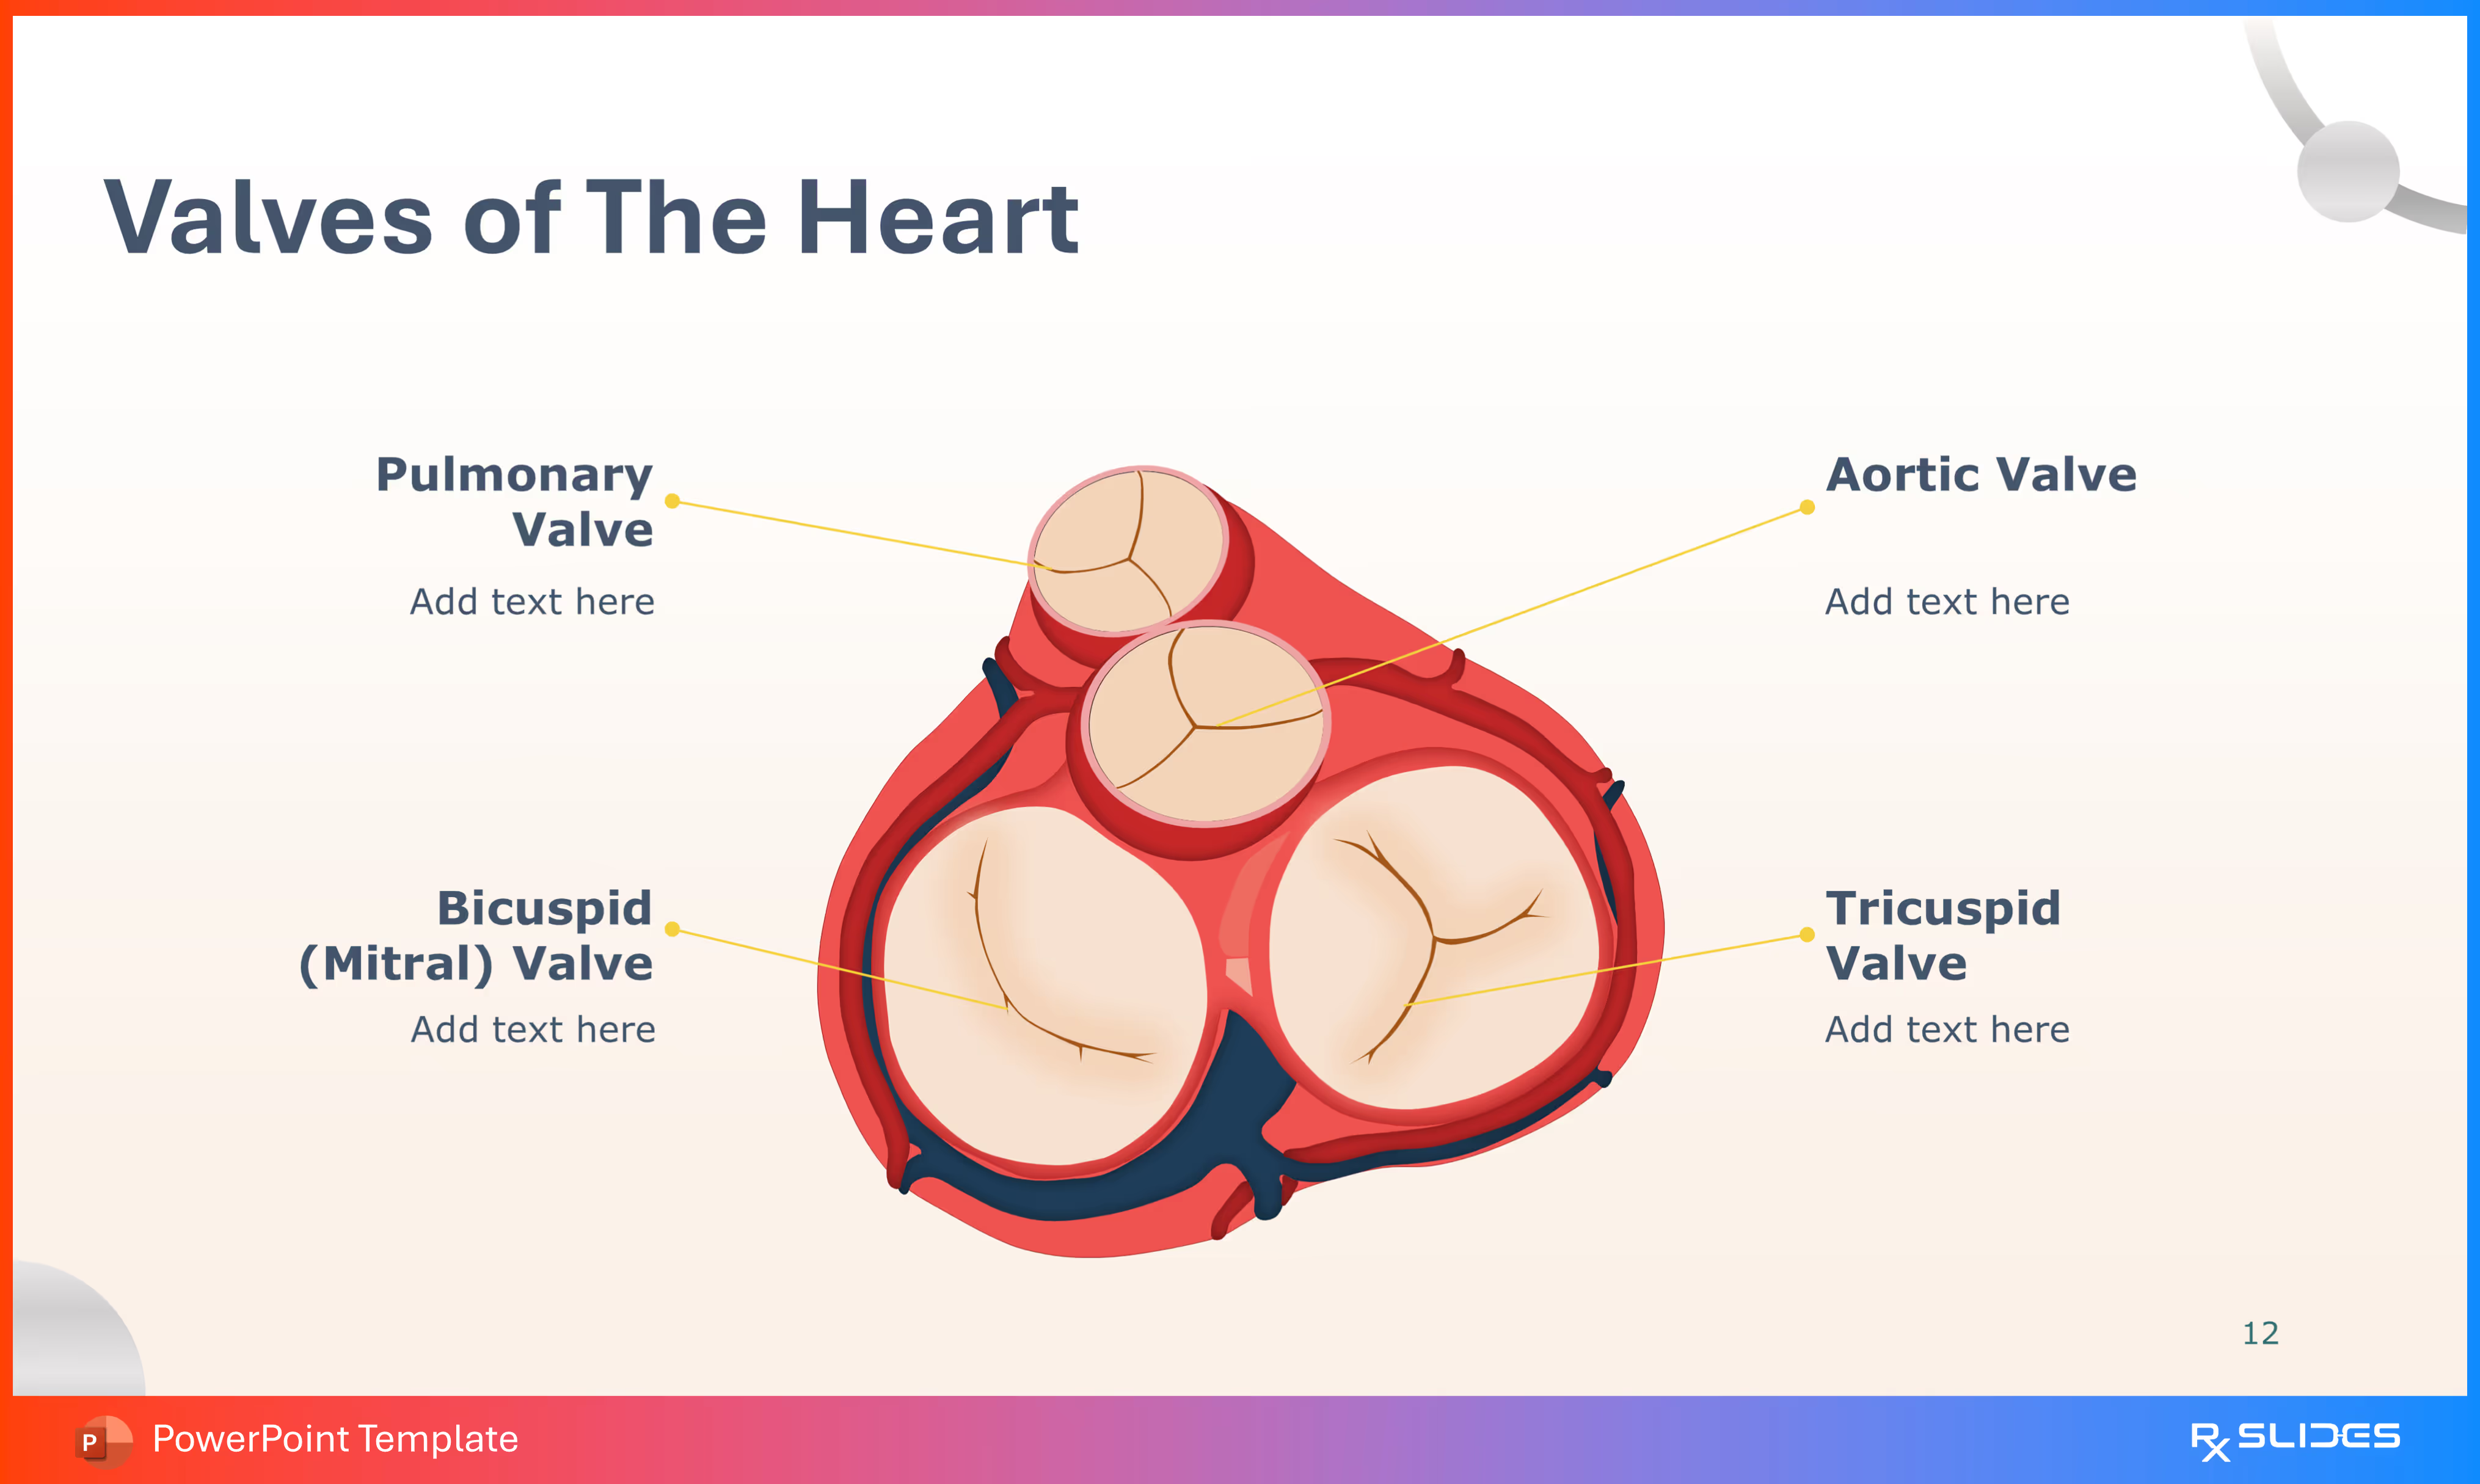
- The slide features a simplified, overhead diagram illustrating the four major heart valves positioned relative to one another.
- The four valves are clearly labeled with placeholder text for descriptions:
- Pulmonary Valve.
- Aortic Valve.
- Bicuspid (Mitral) Valve.
- Tricuspid Valve.
- The diagram uses red and dark blue to suggest the flow paths through the valve structures.
Slide 13 - Cardiac Muscle Histology
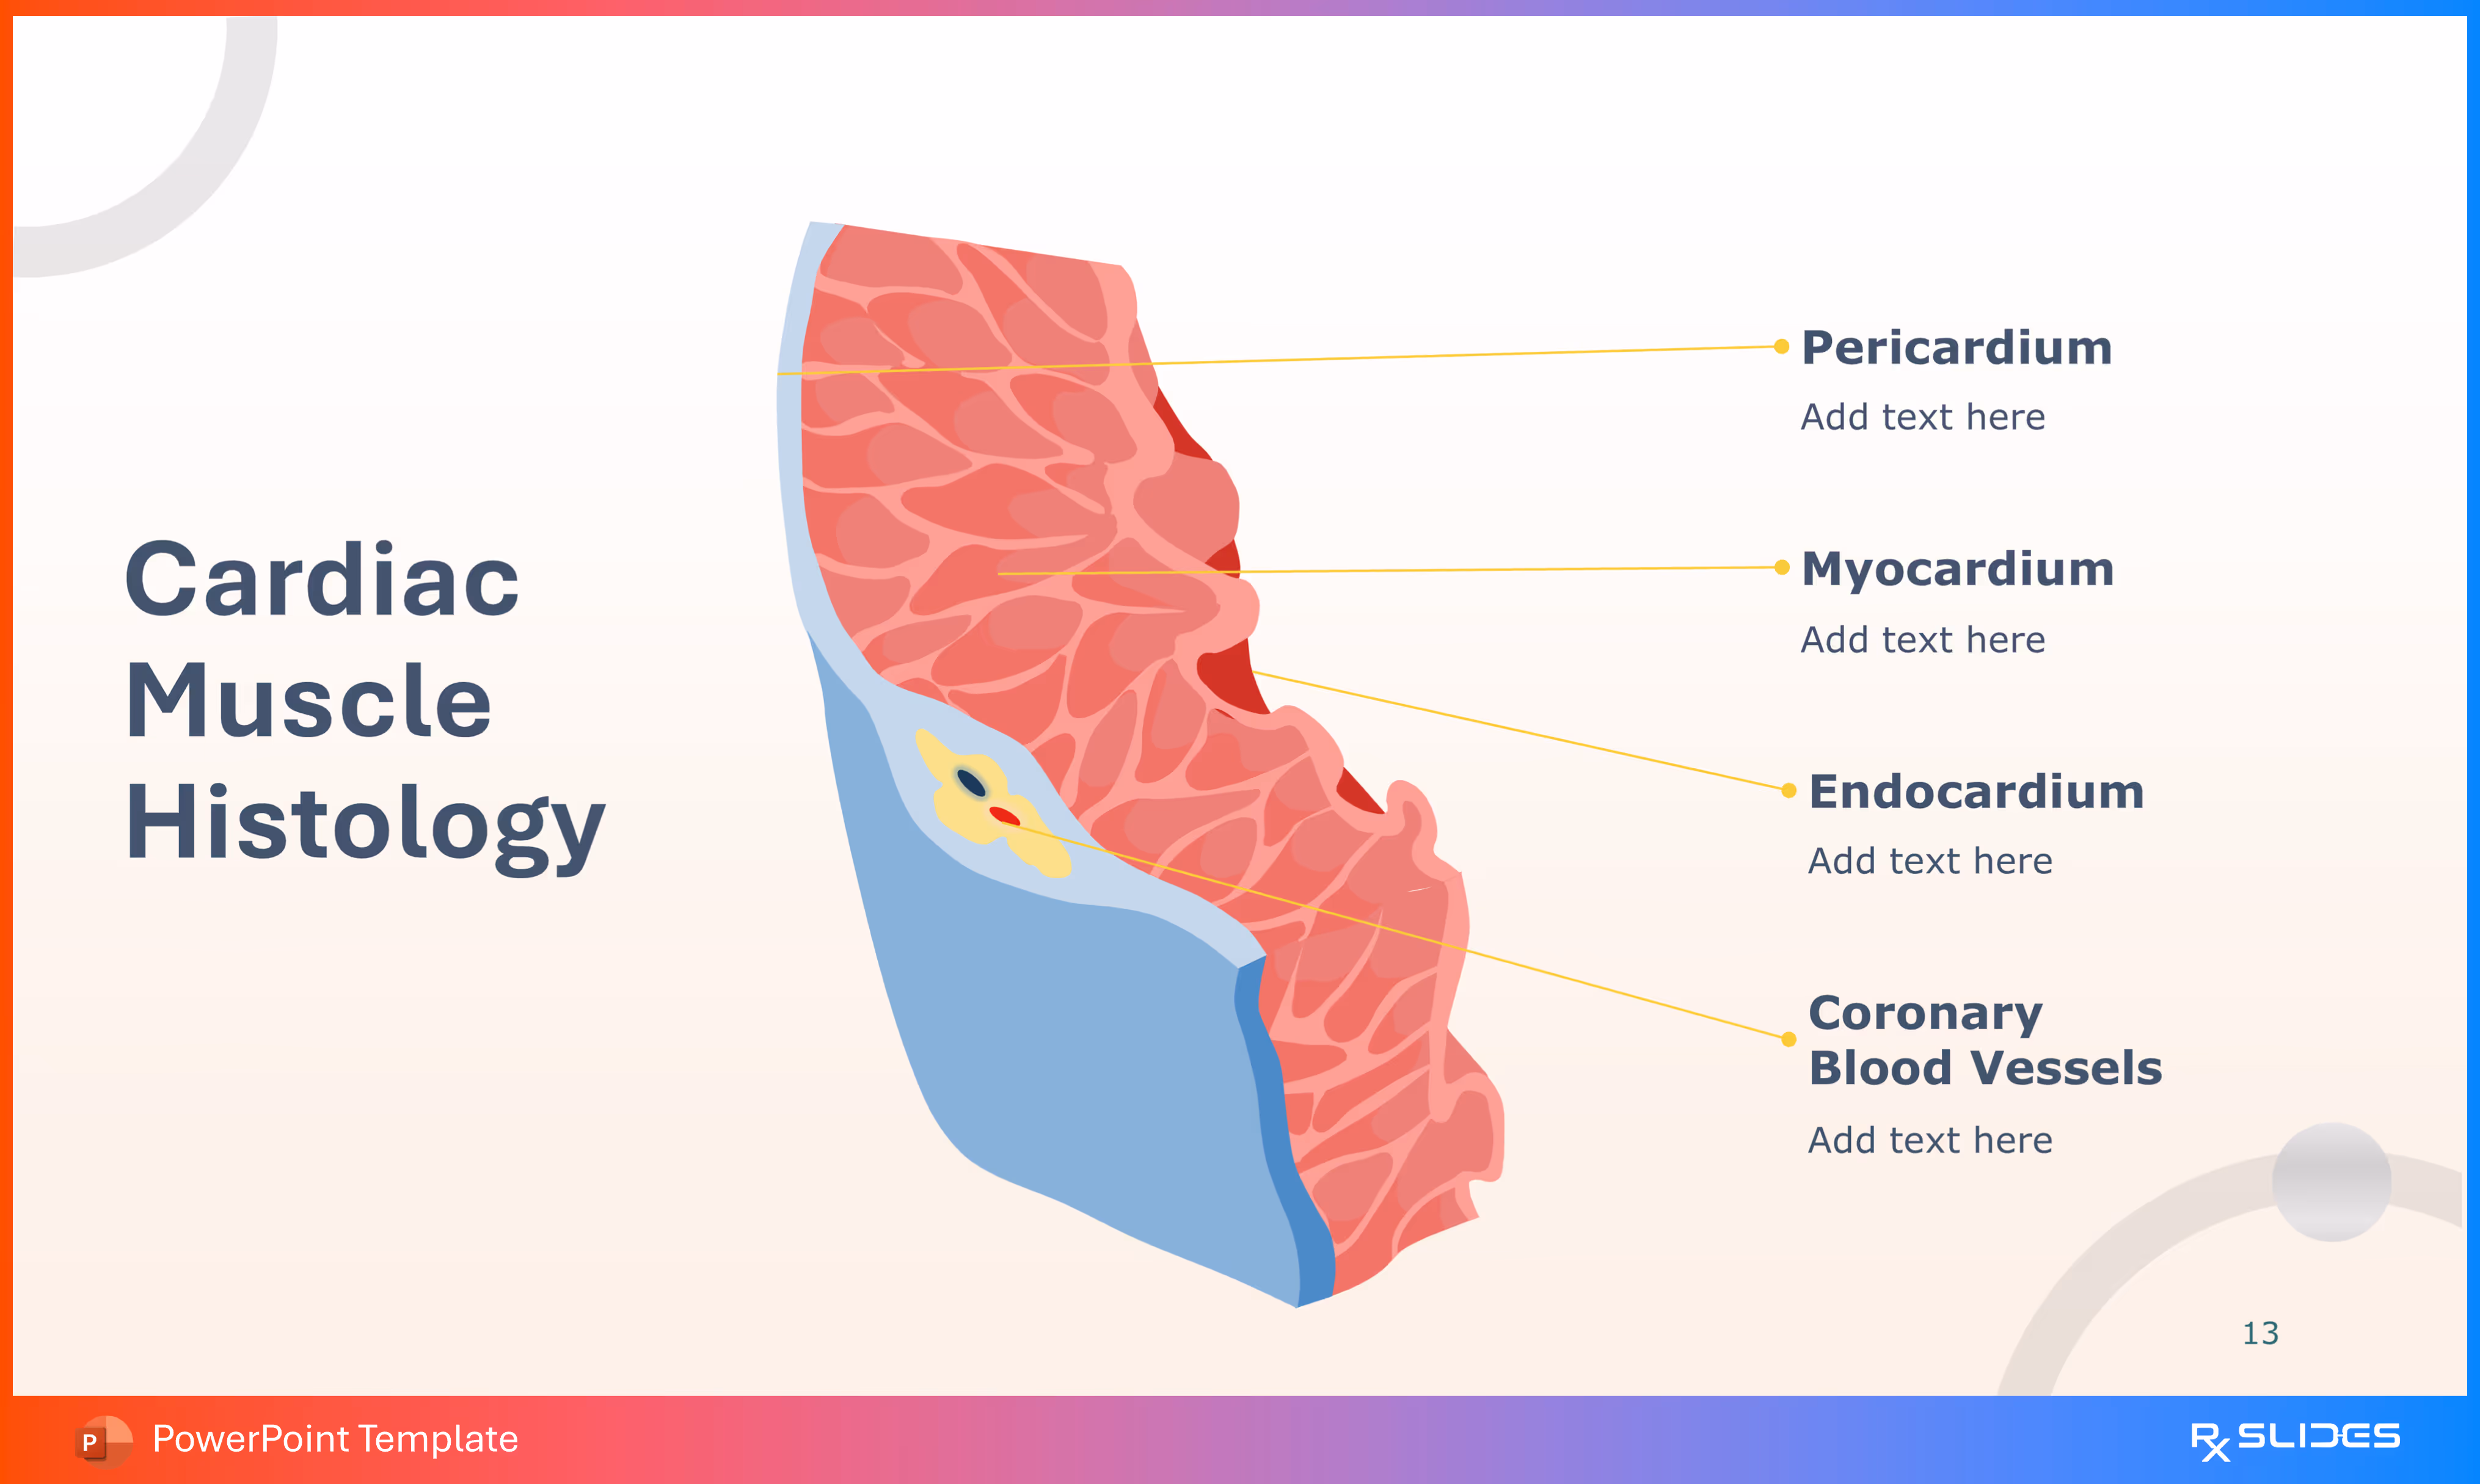
- The slide displays a large, stylized cross-section of the heart wall, showing the layered structure of the cardiac muscle tissue and surrounding components.
- Labeled Structures: Four layers and related structures are pointed out with placeholder text for descriptions:
- Pericardium (Outermost layer).
- Myocardium (Thick, middle muscle layer).
- Endocardium (Innermost layer lining the chambers).
- Coronary Blood Vessels (Shown embedded in the tissue).
- The diagram uses different shades of red and pink for the muscle tissue and blue for the outer covering, adhering to the template's color palette.
Slide 14 - Conduction System of The Heart
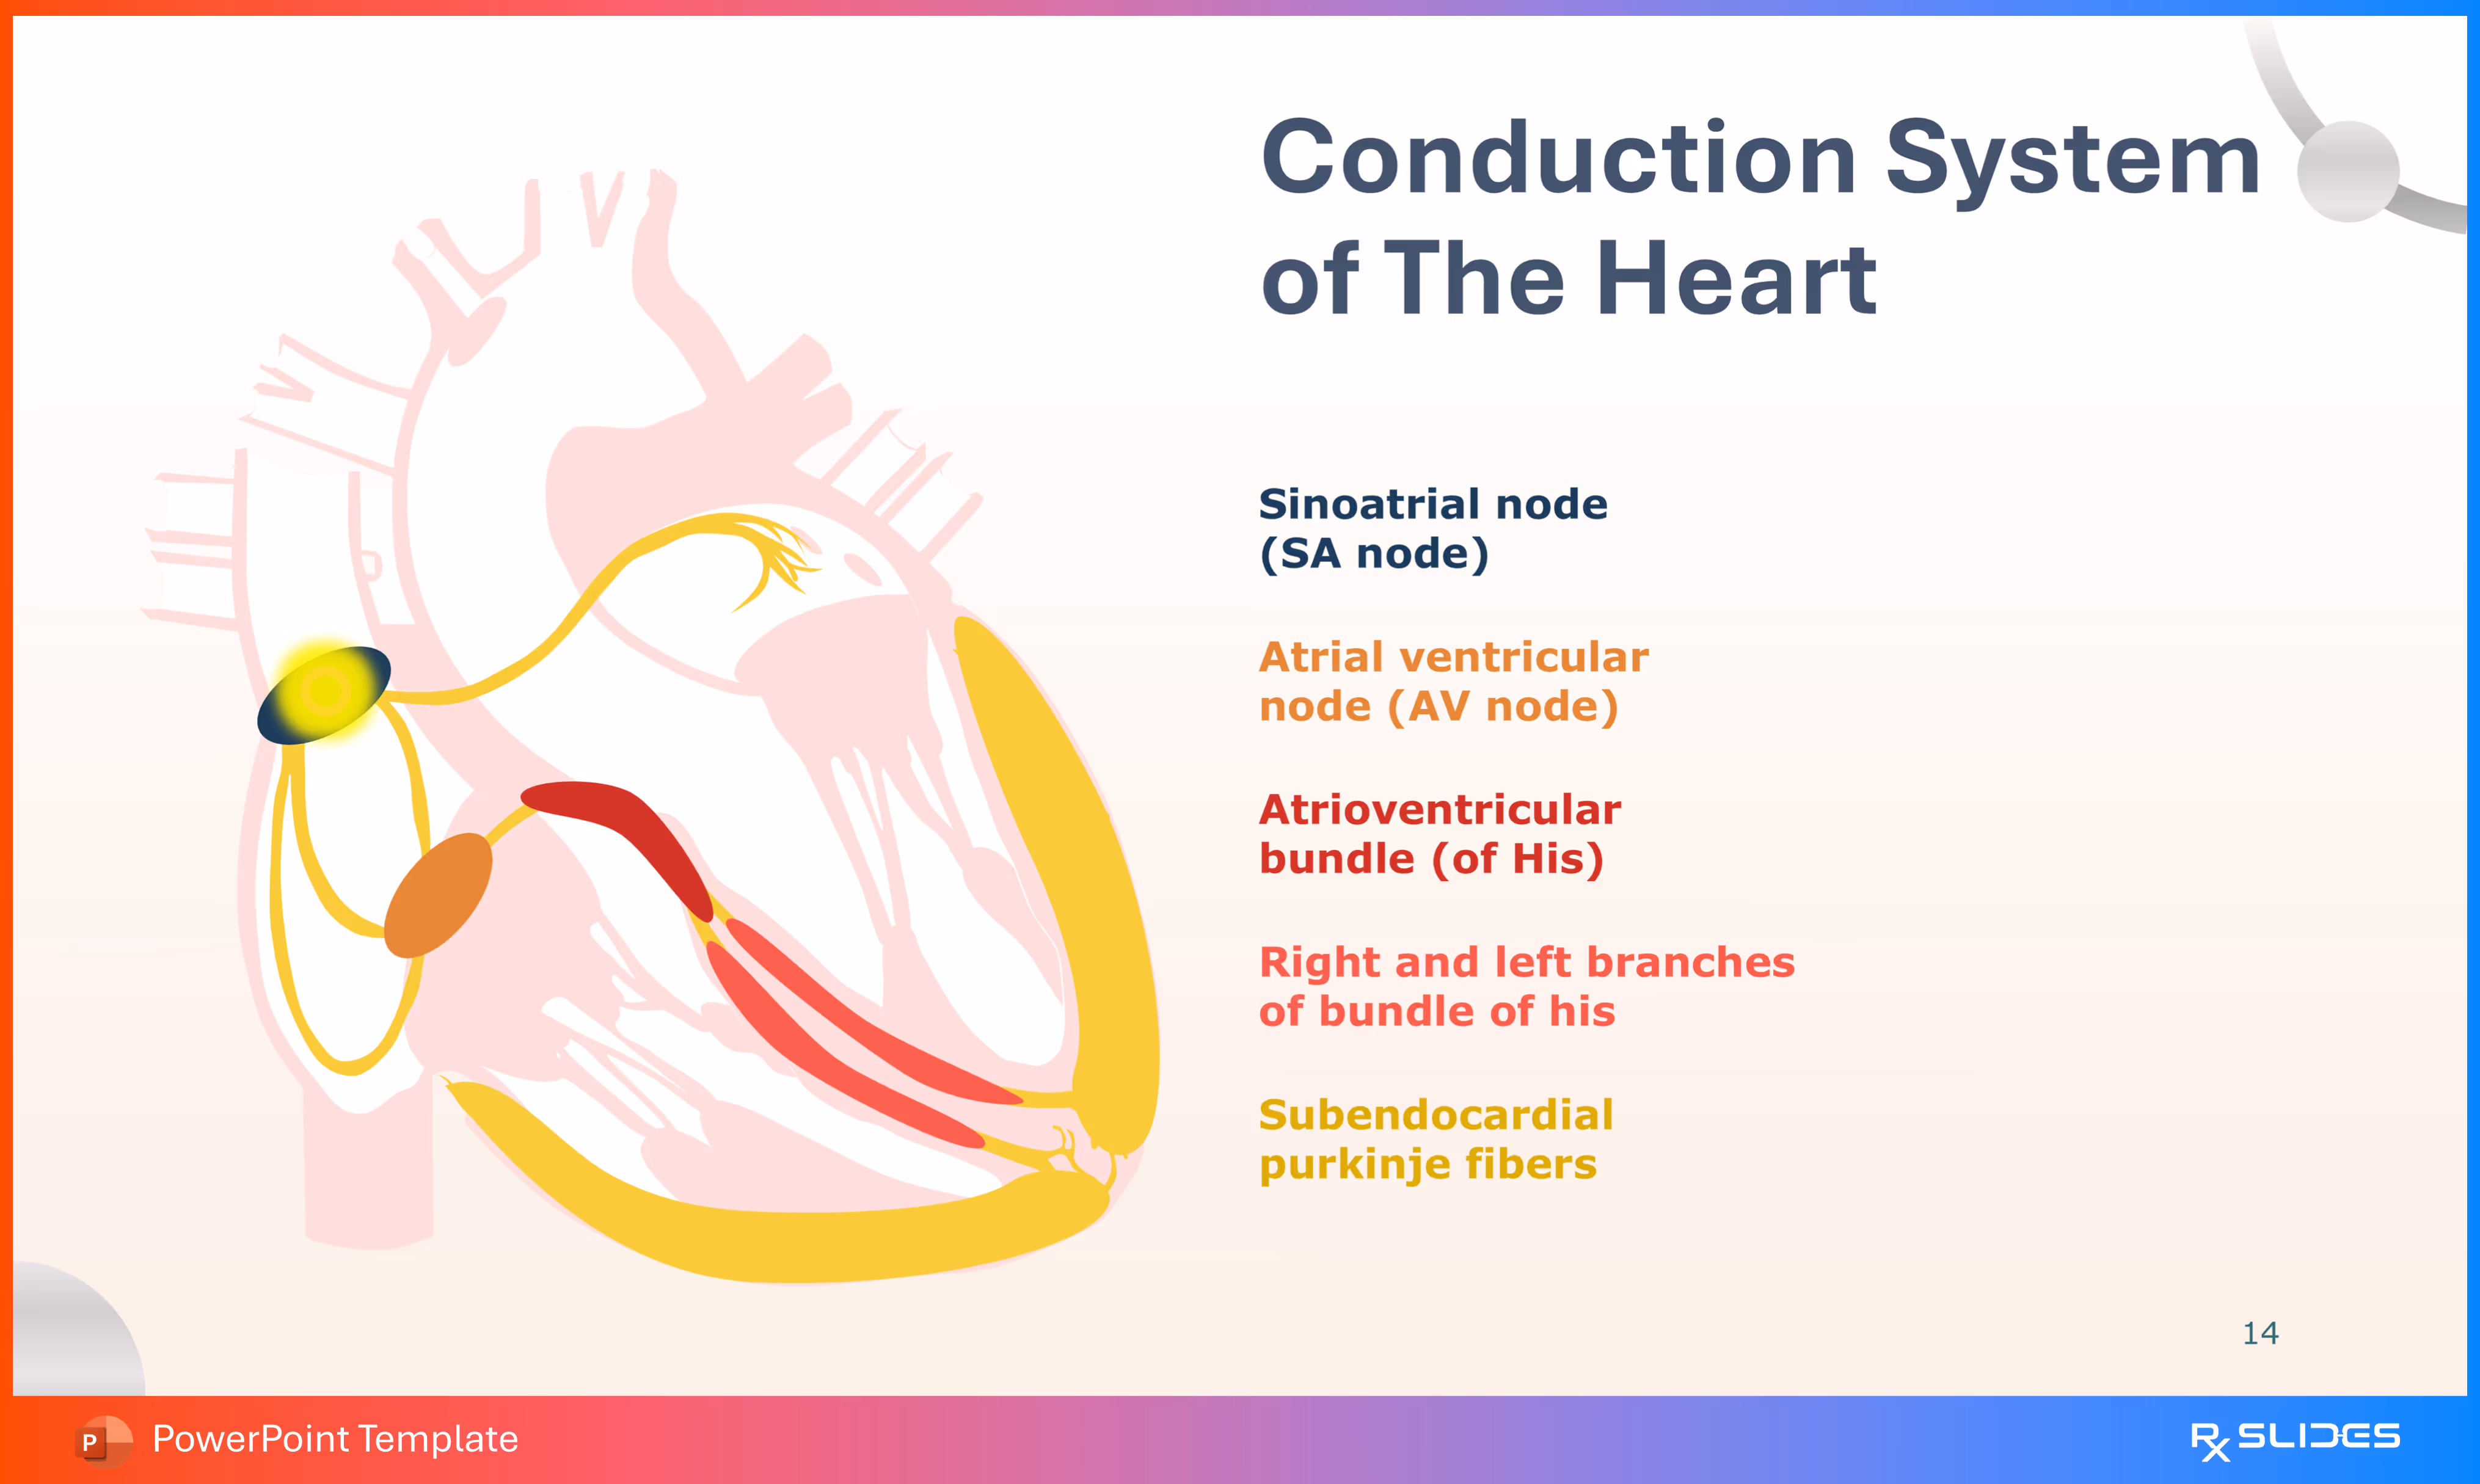
- The slide features a simplified, semi-transparent outline of the heart with a large, detailed illustration of the electrical conduction pathway within it.
- Labeled Structures (Conduction Pathway): Five key components of the electrical system are labeled:
- Sinoatrial node (SA node) (Highlighted in yellow/blue).
- Atrial ventricular node (AV node) (Highlighted in orange).
- Atrioventricular bundle (of His) (Highlighted in red).
- Right and left branches of bundle of his (Highlighted in red).
- Subendocardial purkinje fibers (Highlighted in yellow).
- Aesthetics: The diagram uses bold, contrasting colors (red, orange, yellow, and blue) to trace the flow of the electrical impulse through the heart.
Slide 15 - Blood Vessels (Section Divider)
.avif)
- The slide features a prominent circular icon on the right, which contains a detailed illustration of the heart and major vessels of the upper torso. The image uses red for arteries and dark blue for veins.
- The design maintains the template's characteristic red, dark blue, and white color scheme, signaling the transition from the detailed Heart section to the Blood Vessels section.
Slide 16 - Blood Vessels Histology
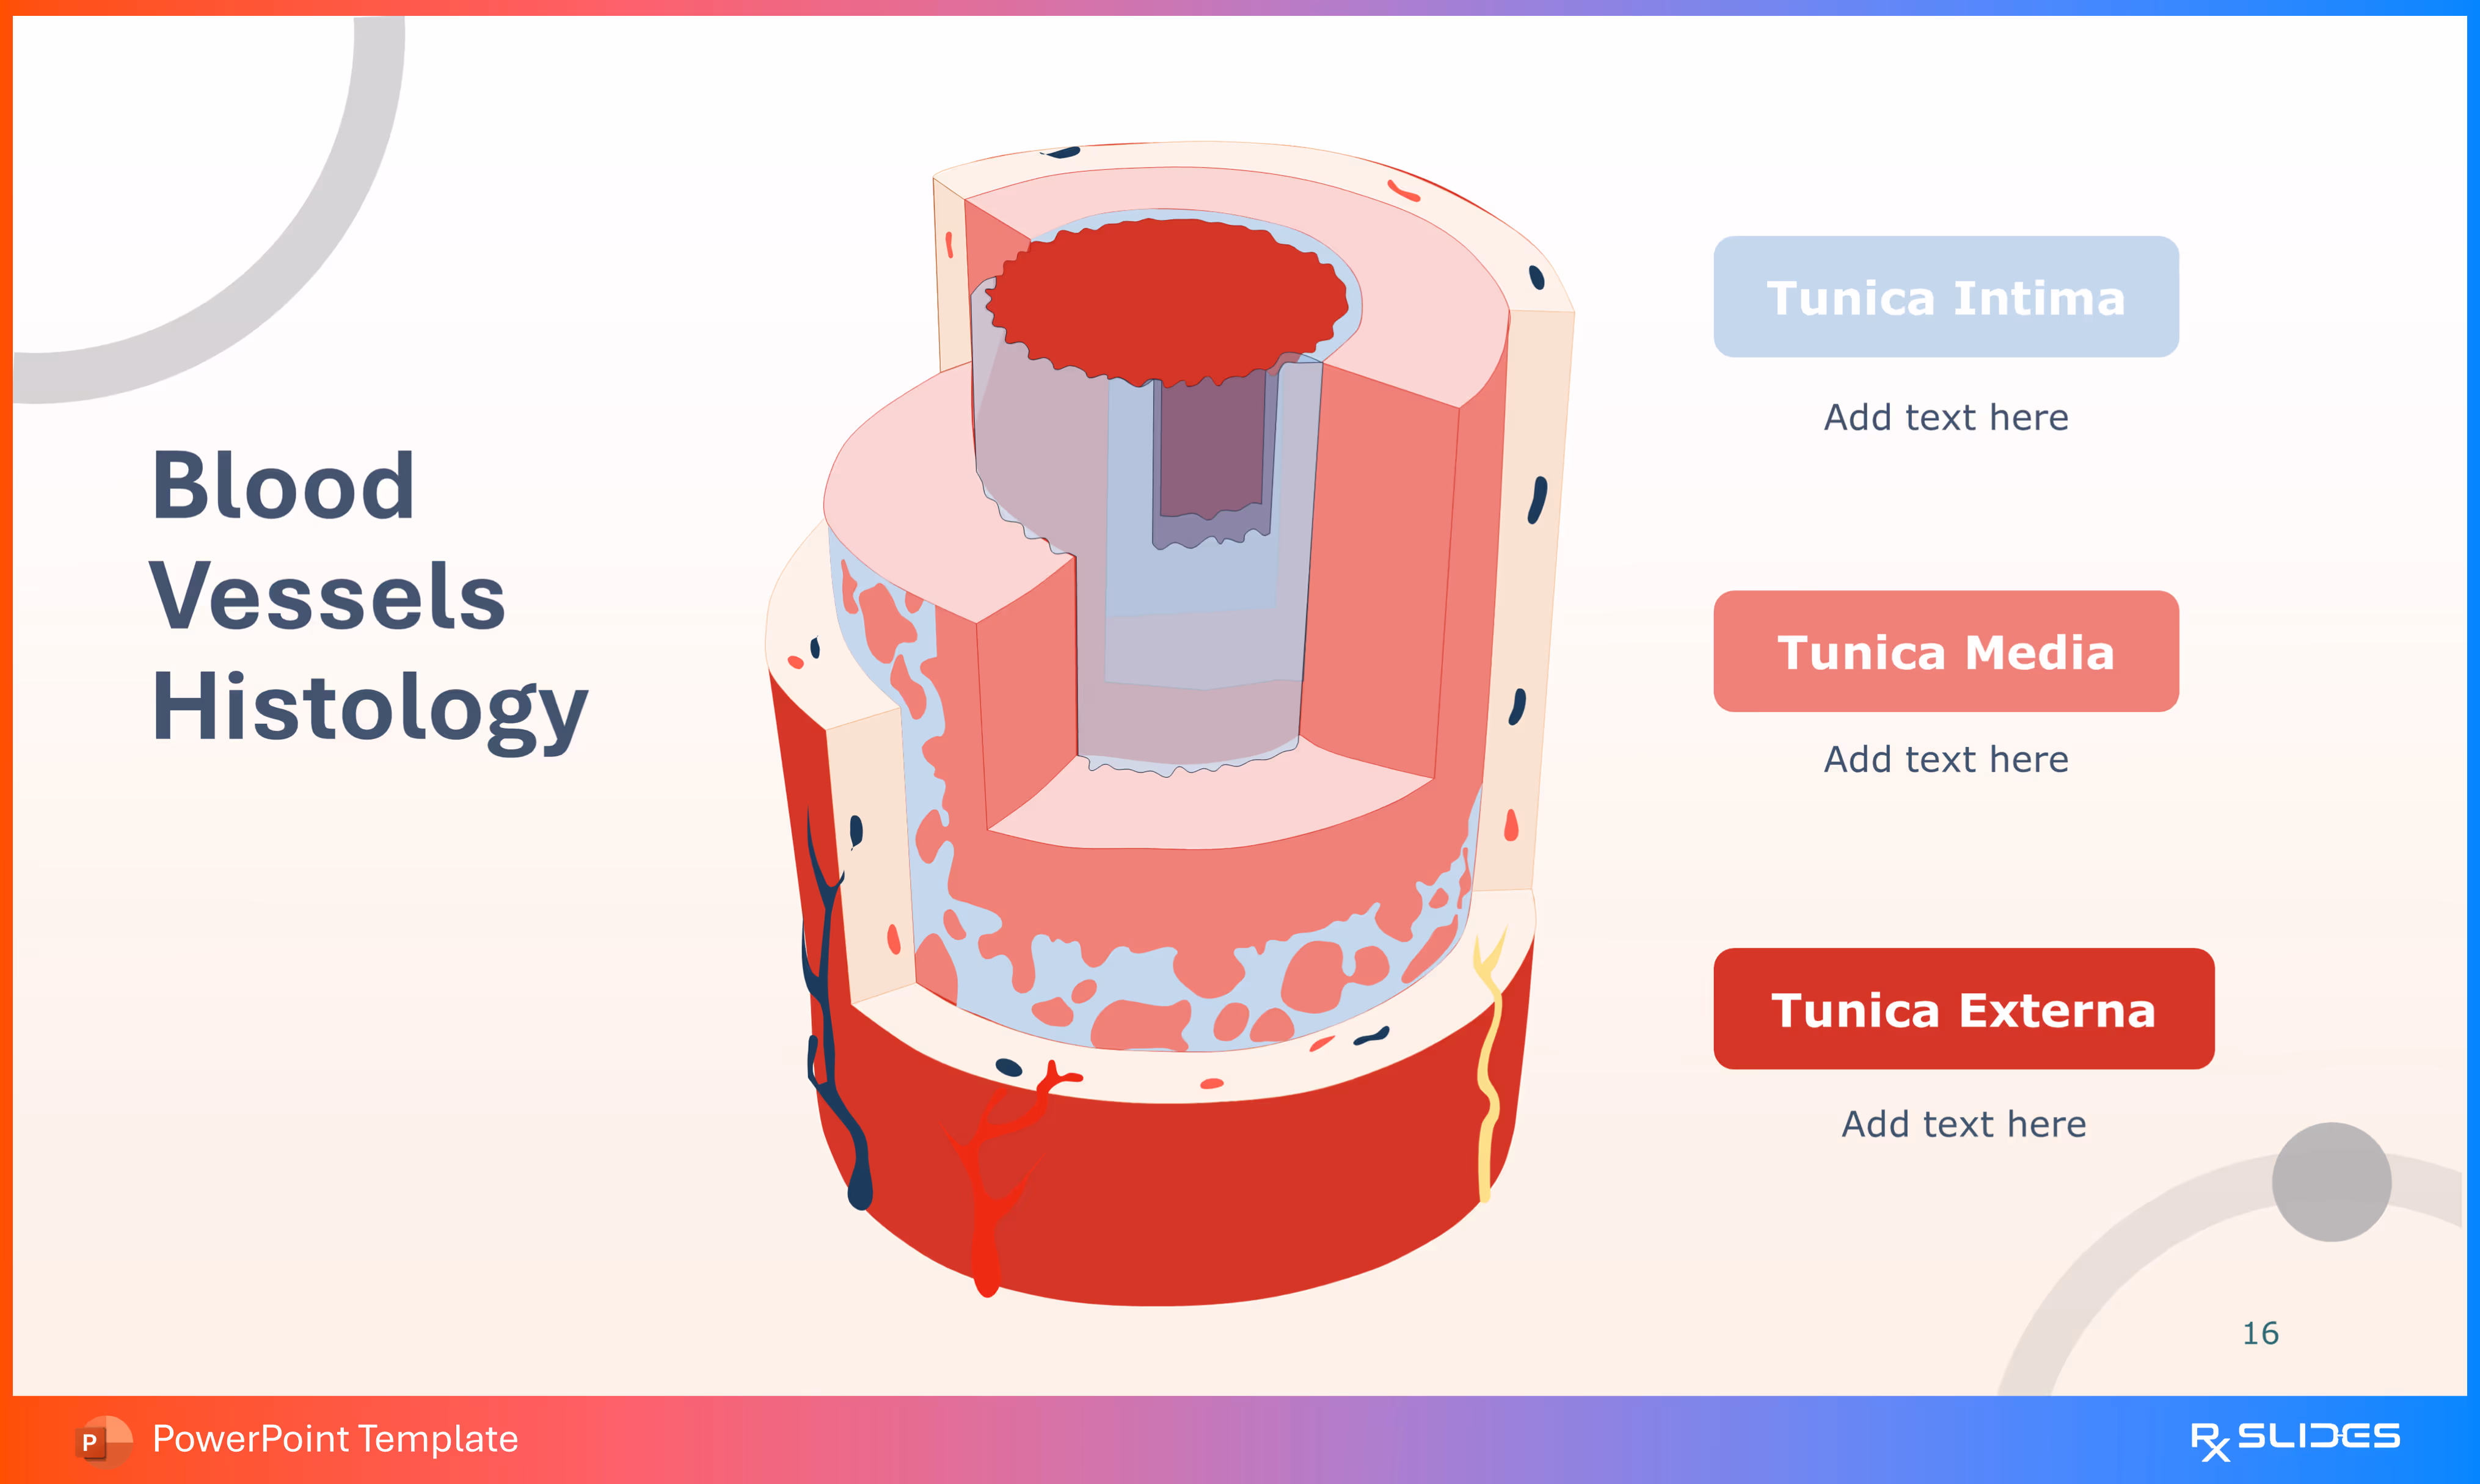
- The slide features a large, stylized, cut-away illustration of a blood vessel cross-section, clearly showing the three concentric layers of the vessel wall.
- The three main layers (tunics) are labeled on the right with color-coded boxes and placeholder text for descriptions:
- Tunica Intima (Innermost layer, light blue box).
- Tunica Media (Middle layer, pink/red box).
- Tunica Externa (Outermost layer, dark red box).
- The diagram uses a 3D isometric style to highlight the layers, with the central lumen (opening) colored dark blue.
Slide 17 - Artery, Vein, and Capillary Network
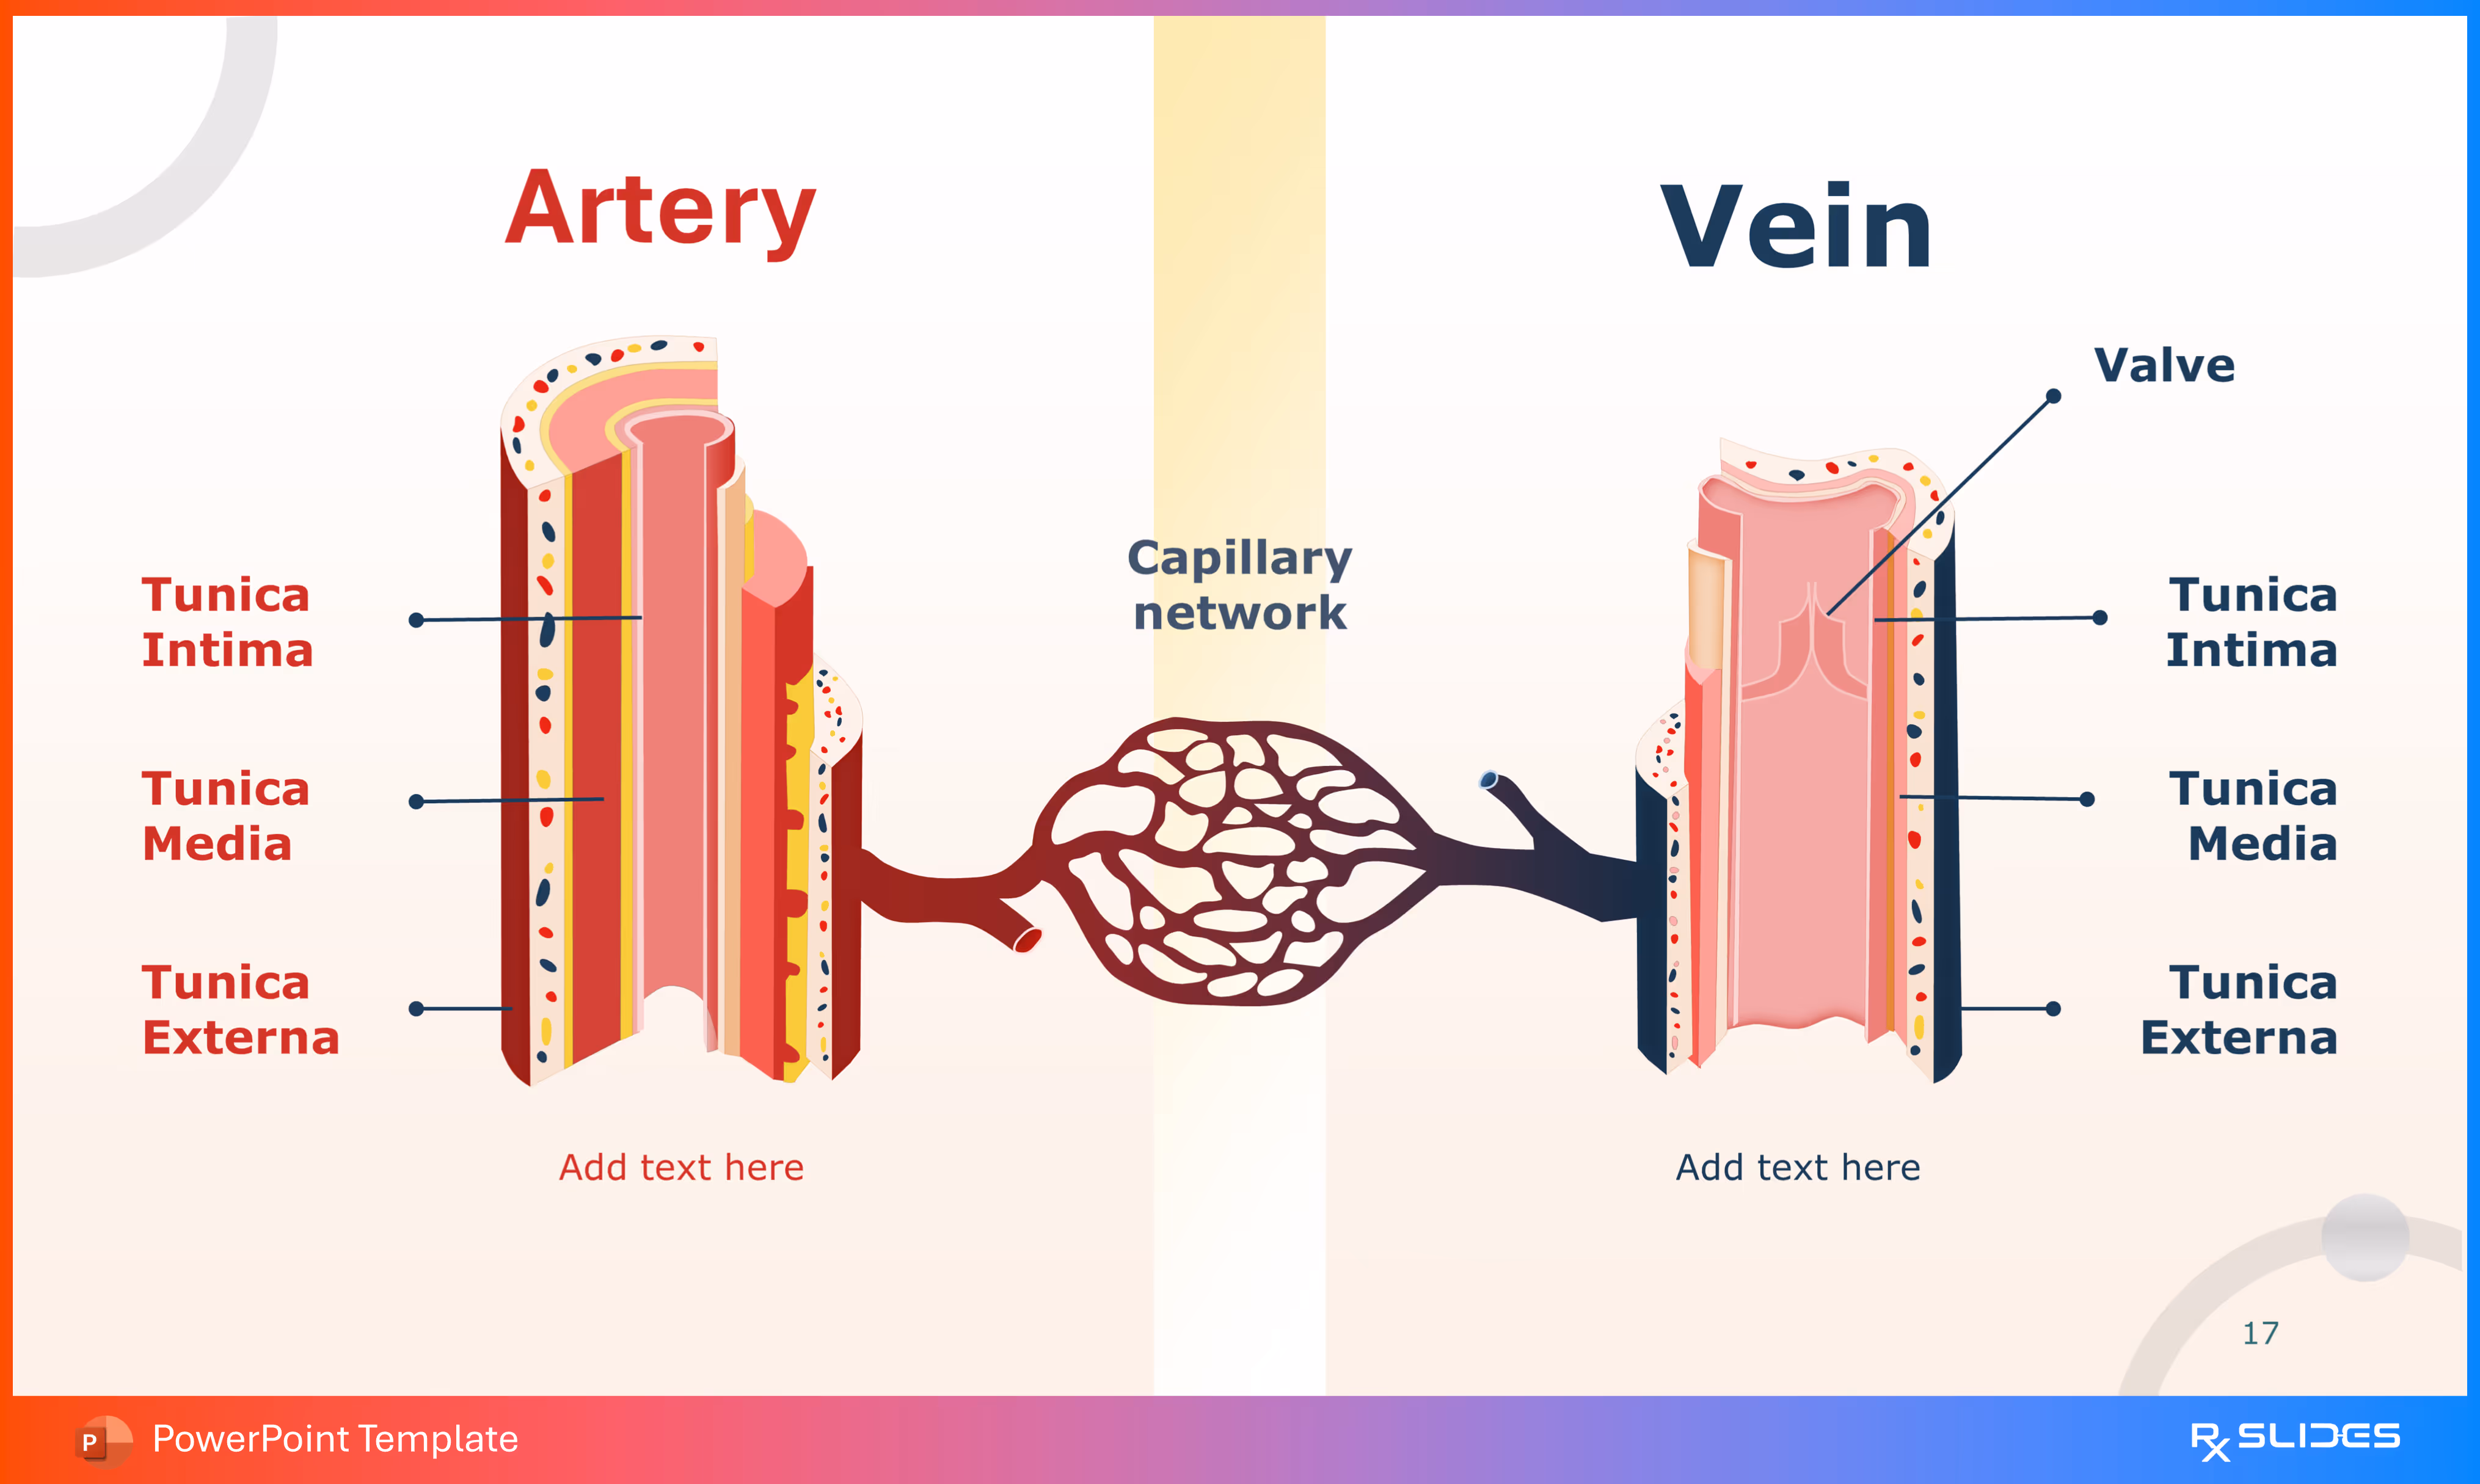
- The slide is divided into sections for Artery and Vein.
- The central figure shows a detailed comparison of a cut-away Artery (left) and Vein (right), connected by a central Capillary network.
- Content & Visuals (Comparison):
- Artery (Left): Shown with a thicker muscular wall (Tunica Media) and smaller lumen. All three layers (Tunica Intima, Tunica Media, Tunica Externa) are labeled.
- Vein (Right): Shown with a thinner wall and a larger, irregularly shaped lumen. It also explicitly labels a Valve within the vein, which is key for venous return. The three tunics are also labeled.
- Capillary network (Center): Positioned between the artery and vein, visually representing the point of exchange.
- Aesthetics: The artery side is dominated by red/yellow tones, while the vein side shifts toward blue/pink, using the template's core colors to distinguish function.
Slide 18 - Blood (Capillary Exchange Detail)
.avif)
- The slide is divided with labels for Artery (left) and Vein (right).
- This slide provides a high-level view of the microcirculation and gas exchange process, connecting the arterial system to the venous system via the capillaries.
- Visual Elements (Flow and Exchange):
- Artery flows into an Arteriole.
- Oxygen (O2) is shown leaving the blood and entering the Tissue cells via the Capillaries.
- Carbon Dioxide (CO2) is shown leaving the tissue and entering the blood.
- The flow continues from the capillaries to the Venule and then the Vein.
- Content Sections: Placeholder text boxes are provided below the Arteriole and Venule cross-sections.
Slide 19 - CVS Physiology (Section Divider)
.avif)
- The slide features a prominent circular icon on the right containing a simplified illustration of the heart.
- The design uses the template's color scheme, with the term "Physiology" highlighted in red, signaling the shift from the anatomical and structural sections (Heart and Blood Vessels) to the functional aspects of the Cardiovascular System.
Slide 20 - CVS Physiology (Dual Pump Function)
.avif)
- The slide features a large, stylized diagram that loops the Pulmonary and Systemic circulation together, illustrating the heart's function as a dual pump.
- Content Sections (Dual Action):
- Right Side Action (Blue): "The right ventricle pumps venous blood to the lung's alveoli or air sacs". This describes the pulmonary loop.
- Left Side Action (Red): "The left side simultaneously pumps blood from the lungs throughout the body". This describes the systemic loop.
- The arrows clearly indicate the direction of blood flow in both the red (oxygenated) and dark blue (deoxygenated) pathways.
Slide 21 - CVS Physiology (Right Ventricle Function)
.avif)
- This slide features a large, detailed cut-away illustration of the heart, focusing on the Right Ventricle and its connection to the pulmonary circulation. A separate illustration of a capillary network at the top right represents the lungs.
- Content Sections (Right Ventricle Role): The accompanying text box highlights two key steps:
- "The right ventricle pumps venous blood to the lung's alveoli or air sacs".
- "The blood turns from deoxygenated blood into oxygenated blood".
- The inside of the right ventricle is colored in dark tones (representing deoxygenated blood) with a green mass, before leading toward the blue/red pulmonary vessels.
Slide 22 - CVS Physiology (Left Ventricle Function)
.avif)
- This slide features a large, detailed cut-away illustration of the heart, focusing on the muscular Left Ventricle. An illustration of the systemic circulation extends from the aorta to the outline of the body on the right.
- Content Sections (Left Ventricle Role): The accompanying text box highlights the systemic function:
- "The left side contracts pushing blood through the aorta".
- "The left side simultaneously pumps blood from the lungs throughout the body".
- The left ventricle is shown in red tones (representing oxygenated blood) emphasizing the heart muscle's role in propelling blood.
Slide 23 - CVS Systole (Valvular Action)
.avif)
- The slide features a large, detailed cross-section of the heart chambers and valves, illustrating the state of the valves during ventricular contraction (systole).
- Content Sections (Valves in Systole): The diagram highlights and describes two key valves on the right:
- Mitral Valve: Labeled with placeholder text for a description, which relates to its closed state during systole.
- Tricuspid Valve: Labeled with placeholder text for a description, also relating to its closed state during systole.
- The cut-away shows the thick muscle walls and the Mitral and Tricuspid valves held closed by the chordae tendineae, preventing backflow into the atria.
Slide 24 - CVS Diastole (Valvular Action)
.avif)
- The slide features a large, detailed cross-section of the heart chambers and valves, illustrating the state of the valves during ventricular relaxation (diastole).
- Content Sections (Valves in Diastole): The diagram highlights and describes two key valves on the right:
- Aortic Valve: Labeled with placeholder text for a description, which relates to its closed state during diastole.
- Pulmonic Valve (correctly known as Pulmonary Valve): Labeled with placeholder text for a description, also relating to its closed state during diastole.
- The cut-away shows the heart relaxing, with the Aortic and Pulmonic semilunar valves closed to prevent backflow from the great vessels into the ventricles.
Slide 25 - Cardiac Output and Venous Return
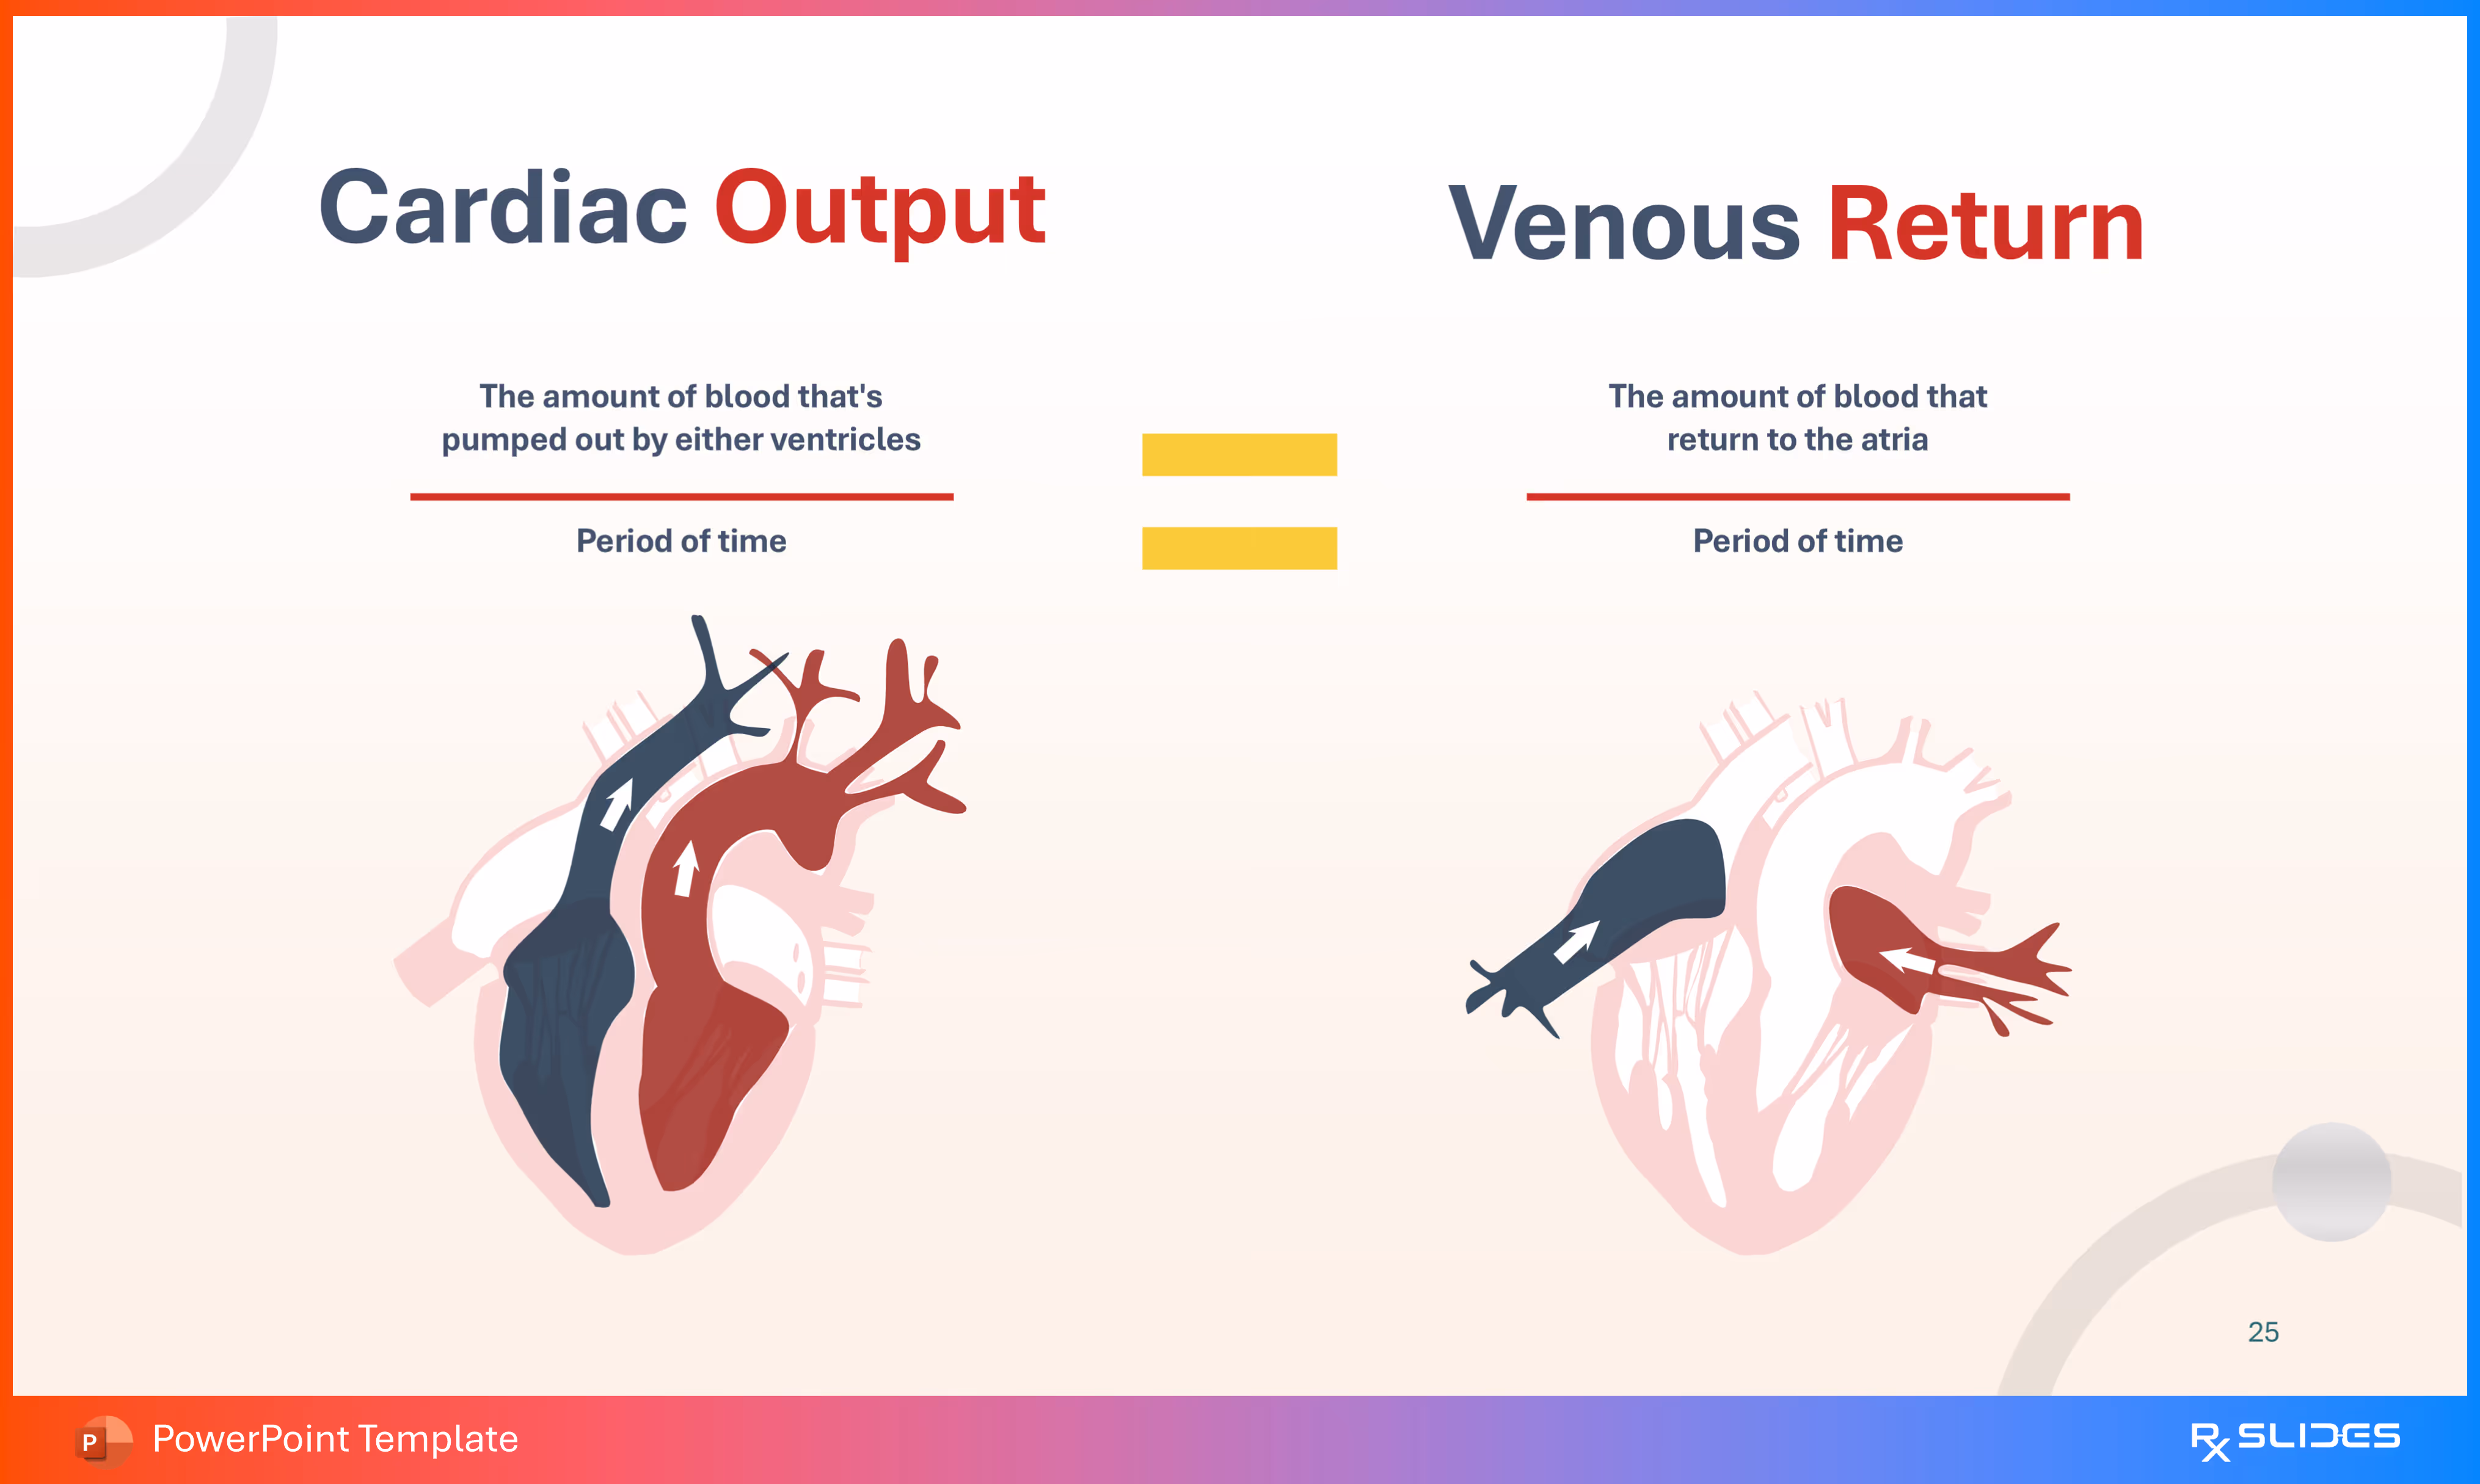
- The slide uses a clear side-by-side comparison format with a large equals sign (=) in the center to visually link the two concepts.
- Content Sections:
- Cardiac Output (Left): Defined as "The amount of blood that's pumped out by either ventricles" over "Period of time".
- Venous Return (Right): Defined as "The amount of blood that return to the atria" over "Period of time".
- Simple, stylized diagrams of the heart are used:
- Cardiac Output shows the heart chambers filling and pumping both red and blue blood.
- Venous Return shows blood flowing back into the atria of the heart.
Slide 26 - Coronary Artery Disease (Diagnosis Section Divider)
.avif)
- The slide features a prominent image of a heart icon next to an ultrasound/echocardiogram probe on a computer screen.
- The design uses large, blurred color circles (red and yellow) in the background and bold red text for the subtitle, signifying the start of the clinical diagnosis portion of the template.
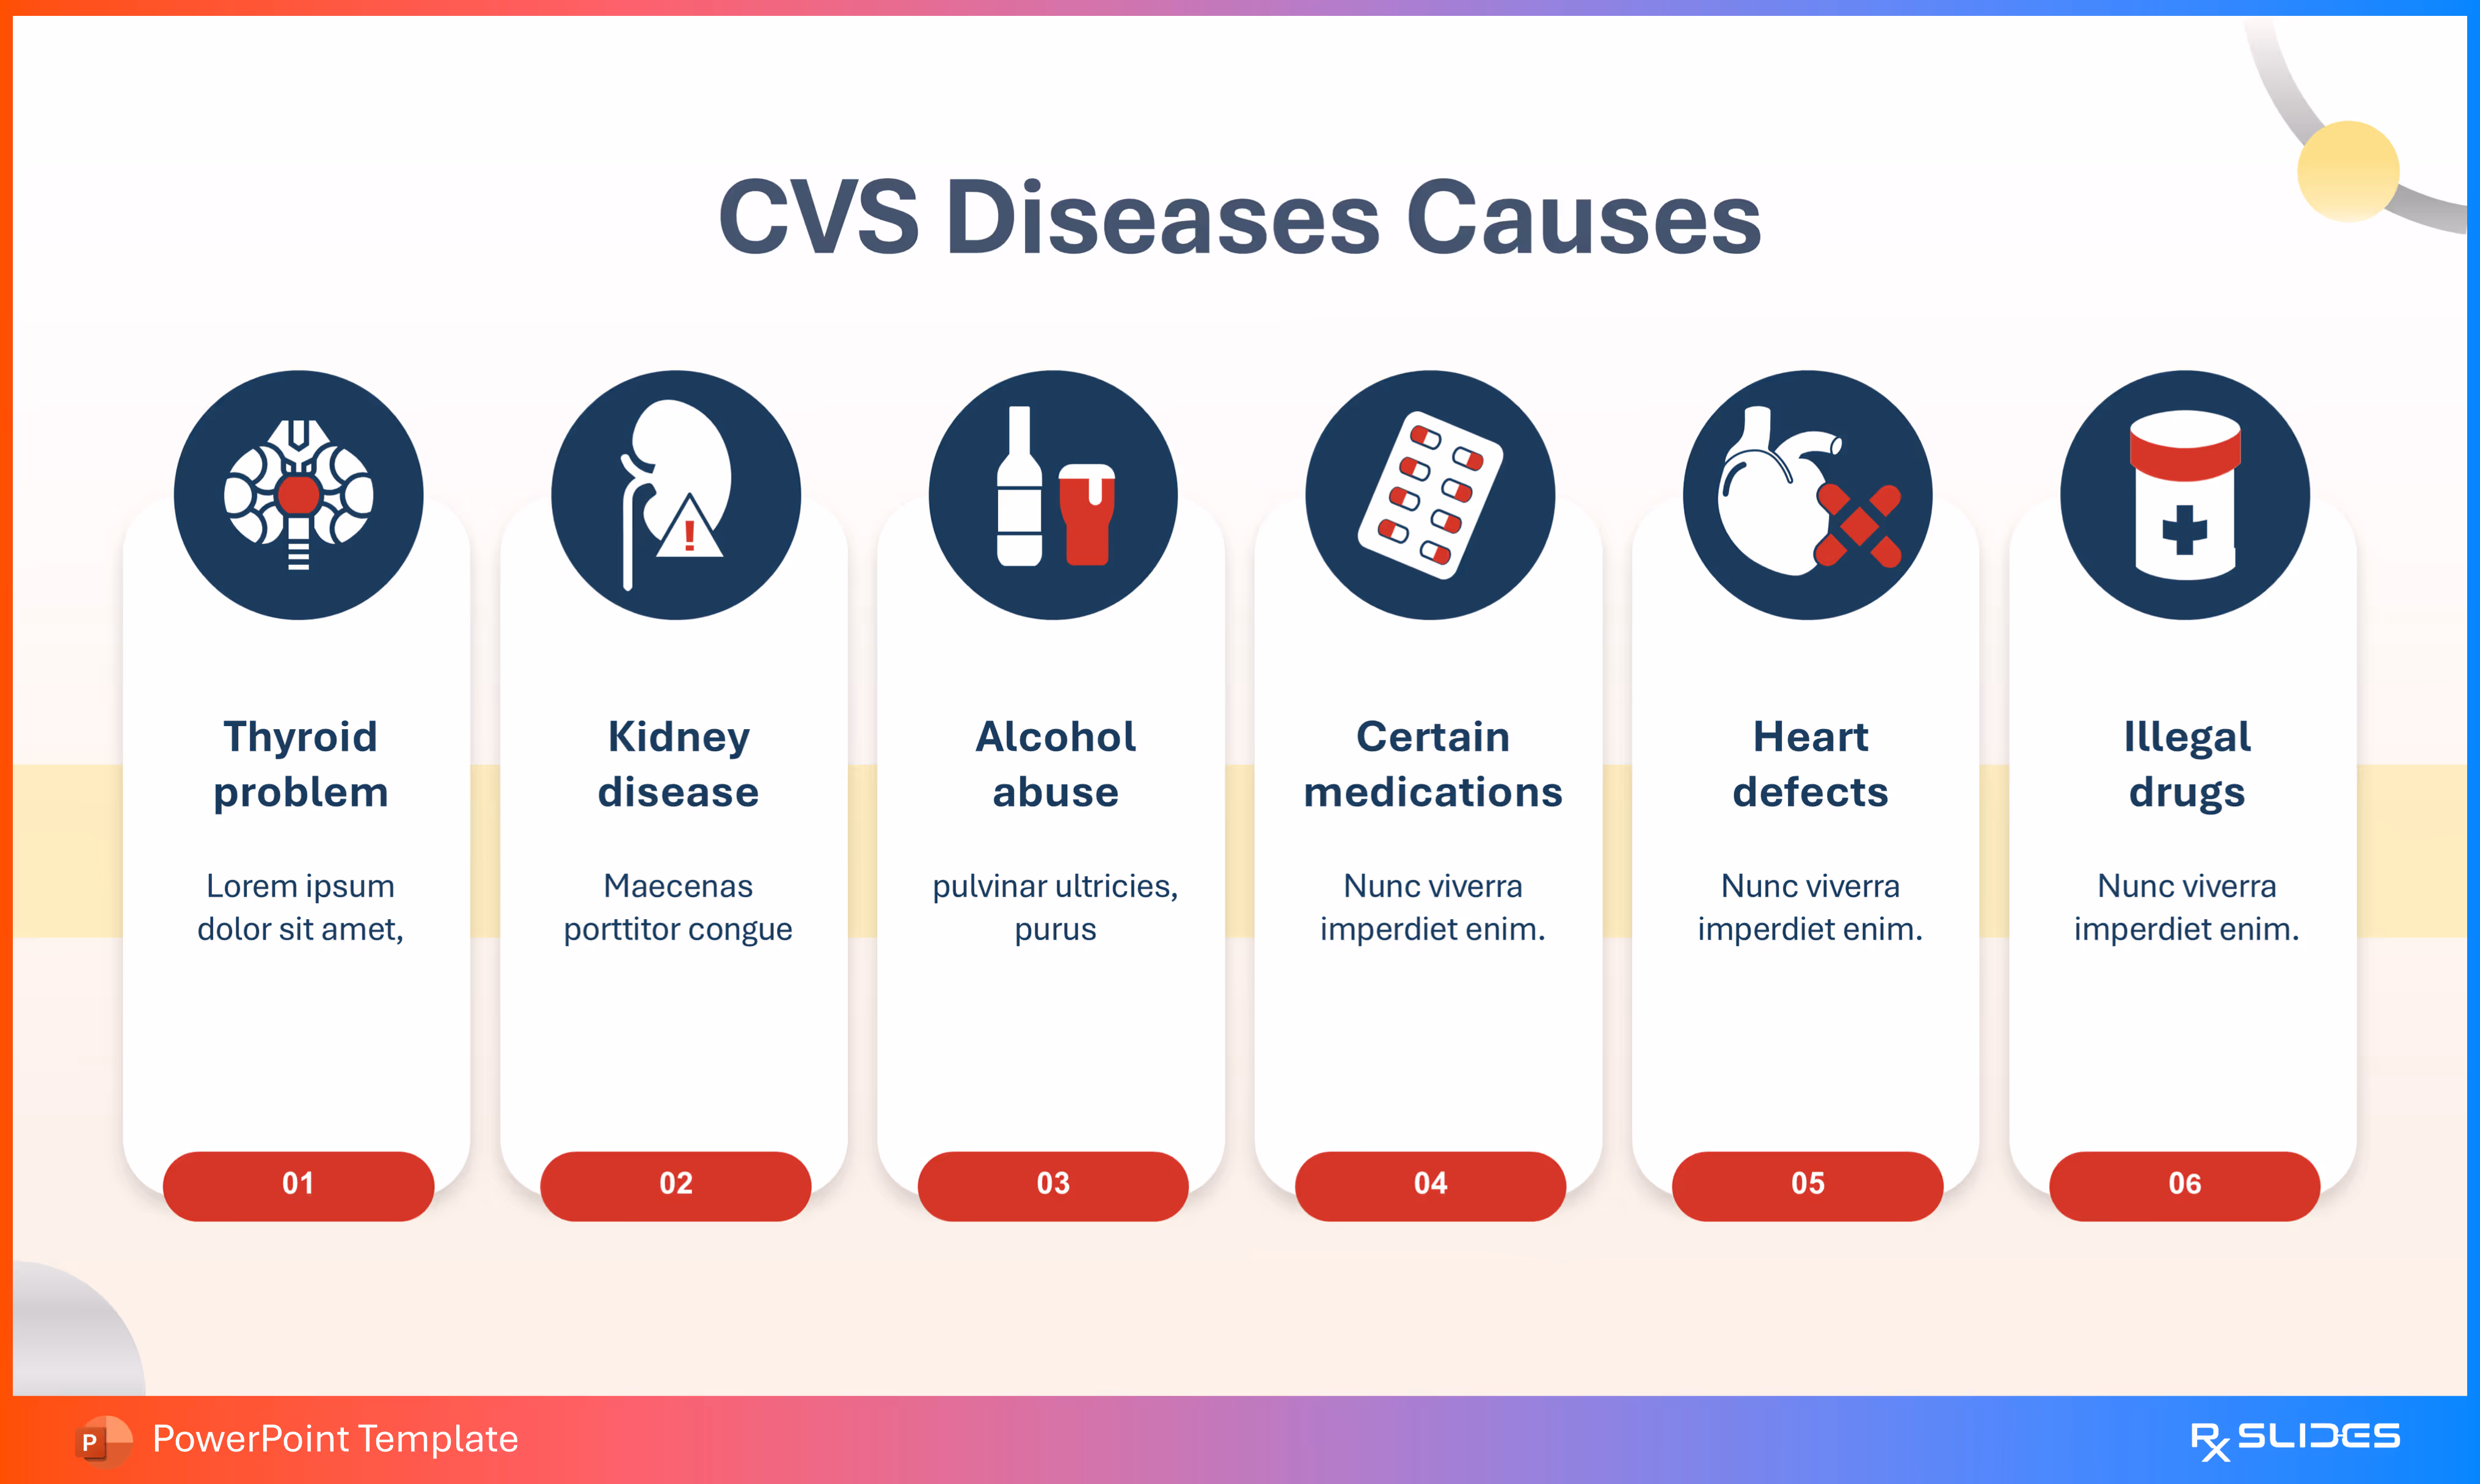
Slide 27 - CVS Diseases Causes
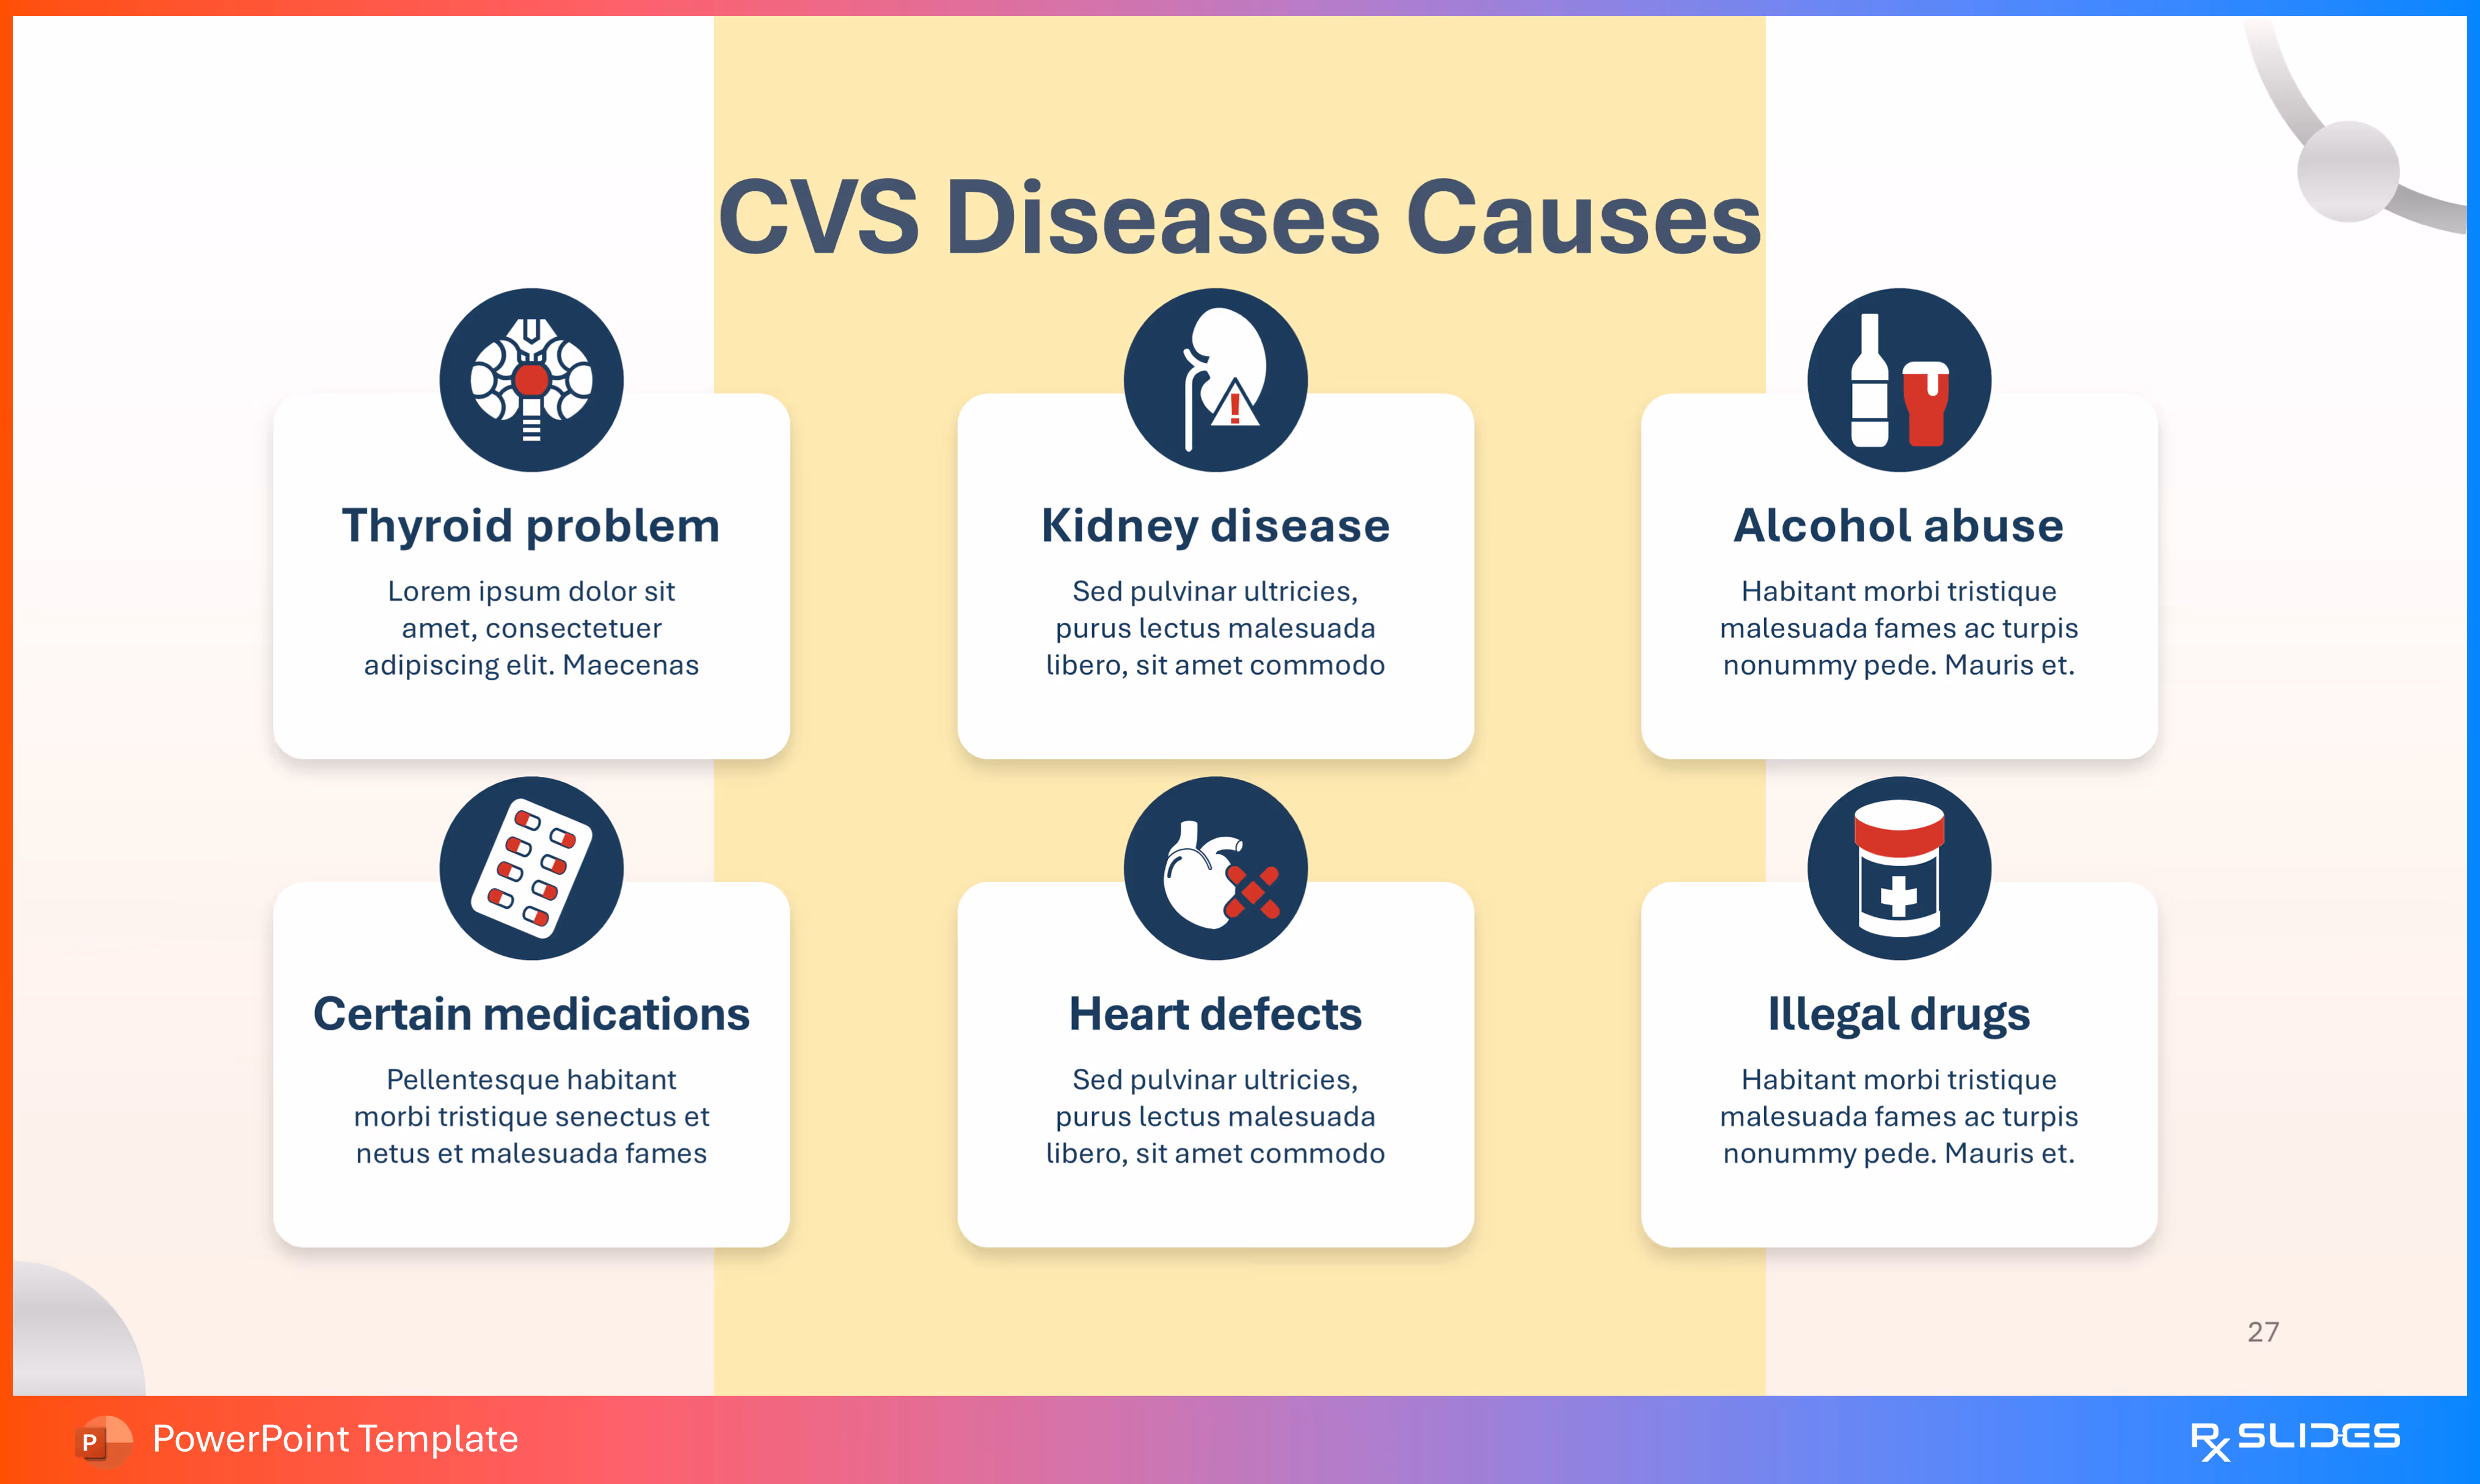
- This slide uses a 2x3 grid layout to list six distinct causes of cardiovascular diseases.
- Each cause is presented with a related icon (inside a circular badge) and placeholder text:
- Thyroid problem (Icon of a thyroid gland with a heart inside).
- Kidney disease (Icon of a kidney).
- Alcohol abuse (Icon of a heart inside a bottle).
- Certain medications (Icon of a pill blister pack).
- Heart defects (Icon of a heart with a crack).
- Illegal drugs (Icon of a medicine bottle with a cross).
Slide 28 - Ischemic Heart Disease Diagnosis
- The slide uses a horizontal four-box format to list and describe common diagnostic tools.
- Content Sections (Diagnostic Tools):
- CT scan: Icon shows a cross-section of a CT scanner.
- Electrocardiogram (ECG/EKG): Icon shows a heart rate tracing on a monitor.
- Cardiac catheterization: Icon shows a heart being accessed by a catheter/syringe.
- Echocardiogram: Icon shows a heart on a monitor with a probe.
- Each diagnostic tool has a prominent icon inside a rounded red or yellow rectangular card, with a place for a description below.
Slide 29 - CVS Diseases Risk Factors (Section Divider)
.avif)
- The slide features a prominent circular icon containing an illustration of a blood droplet with small dots and a red upward arrow, signifying elements in the blood (like cholesterol) or a rising issue (risk).
- The design uses the template's dark blue, red, and white scheme to clearly separate this clinical/pathology section on risk factors.
Slide 30 - CVS Diseases Risk Factors
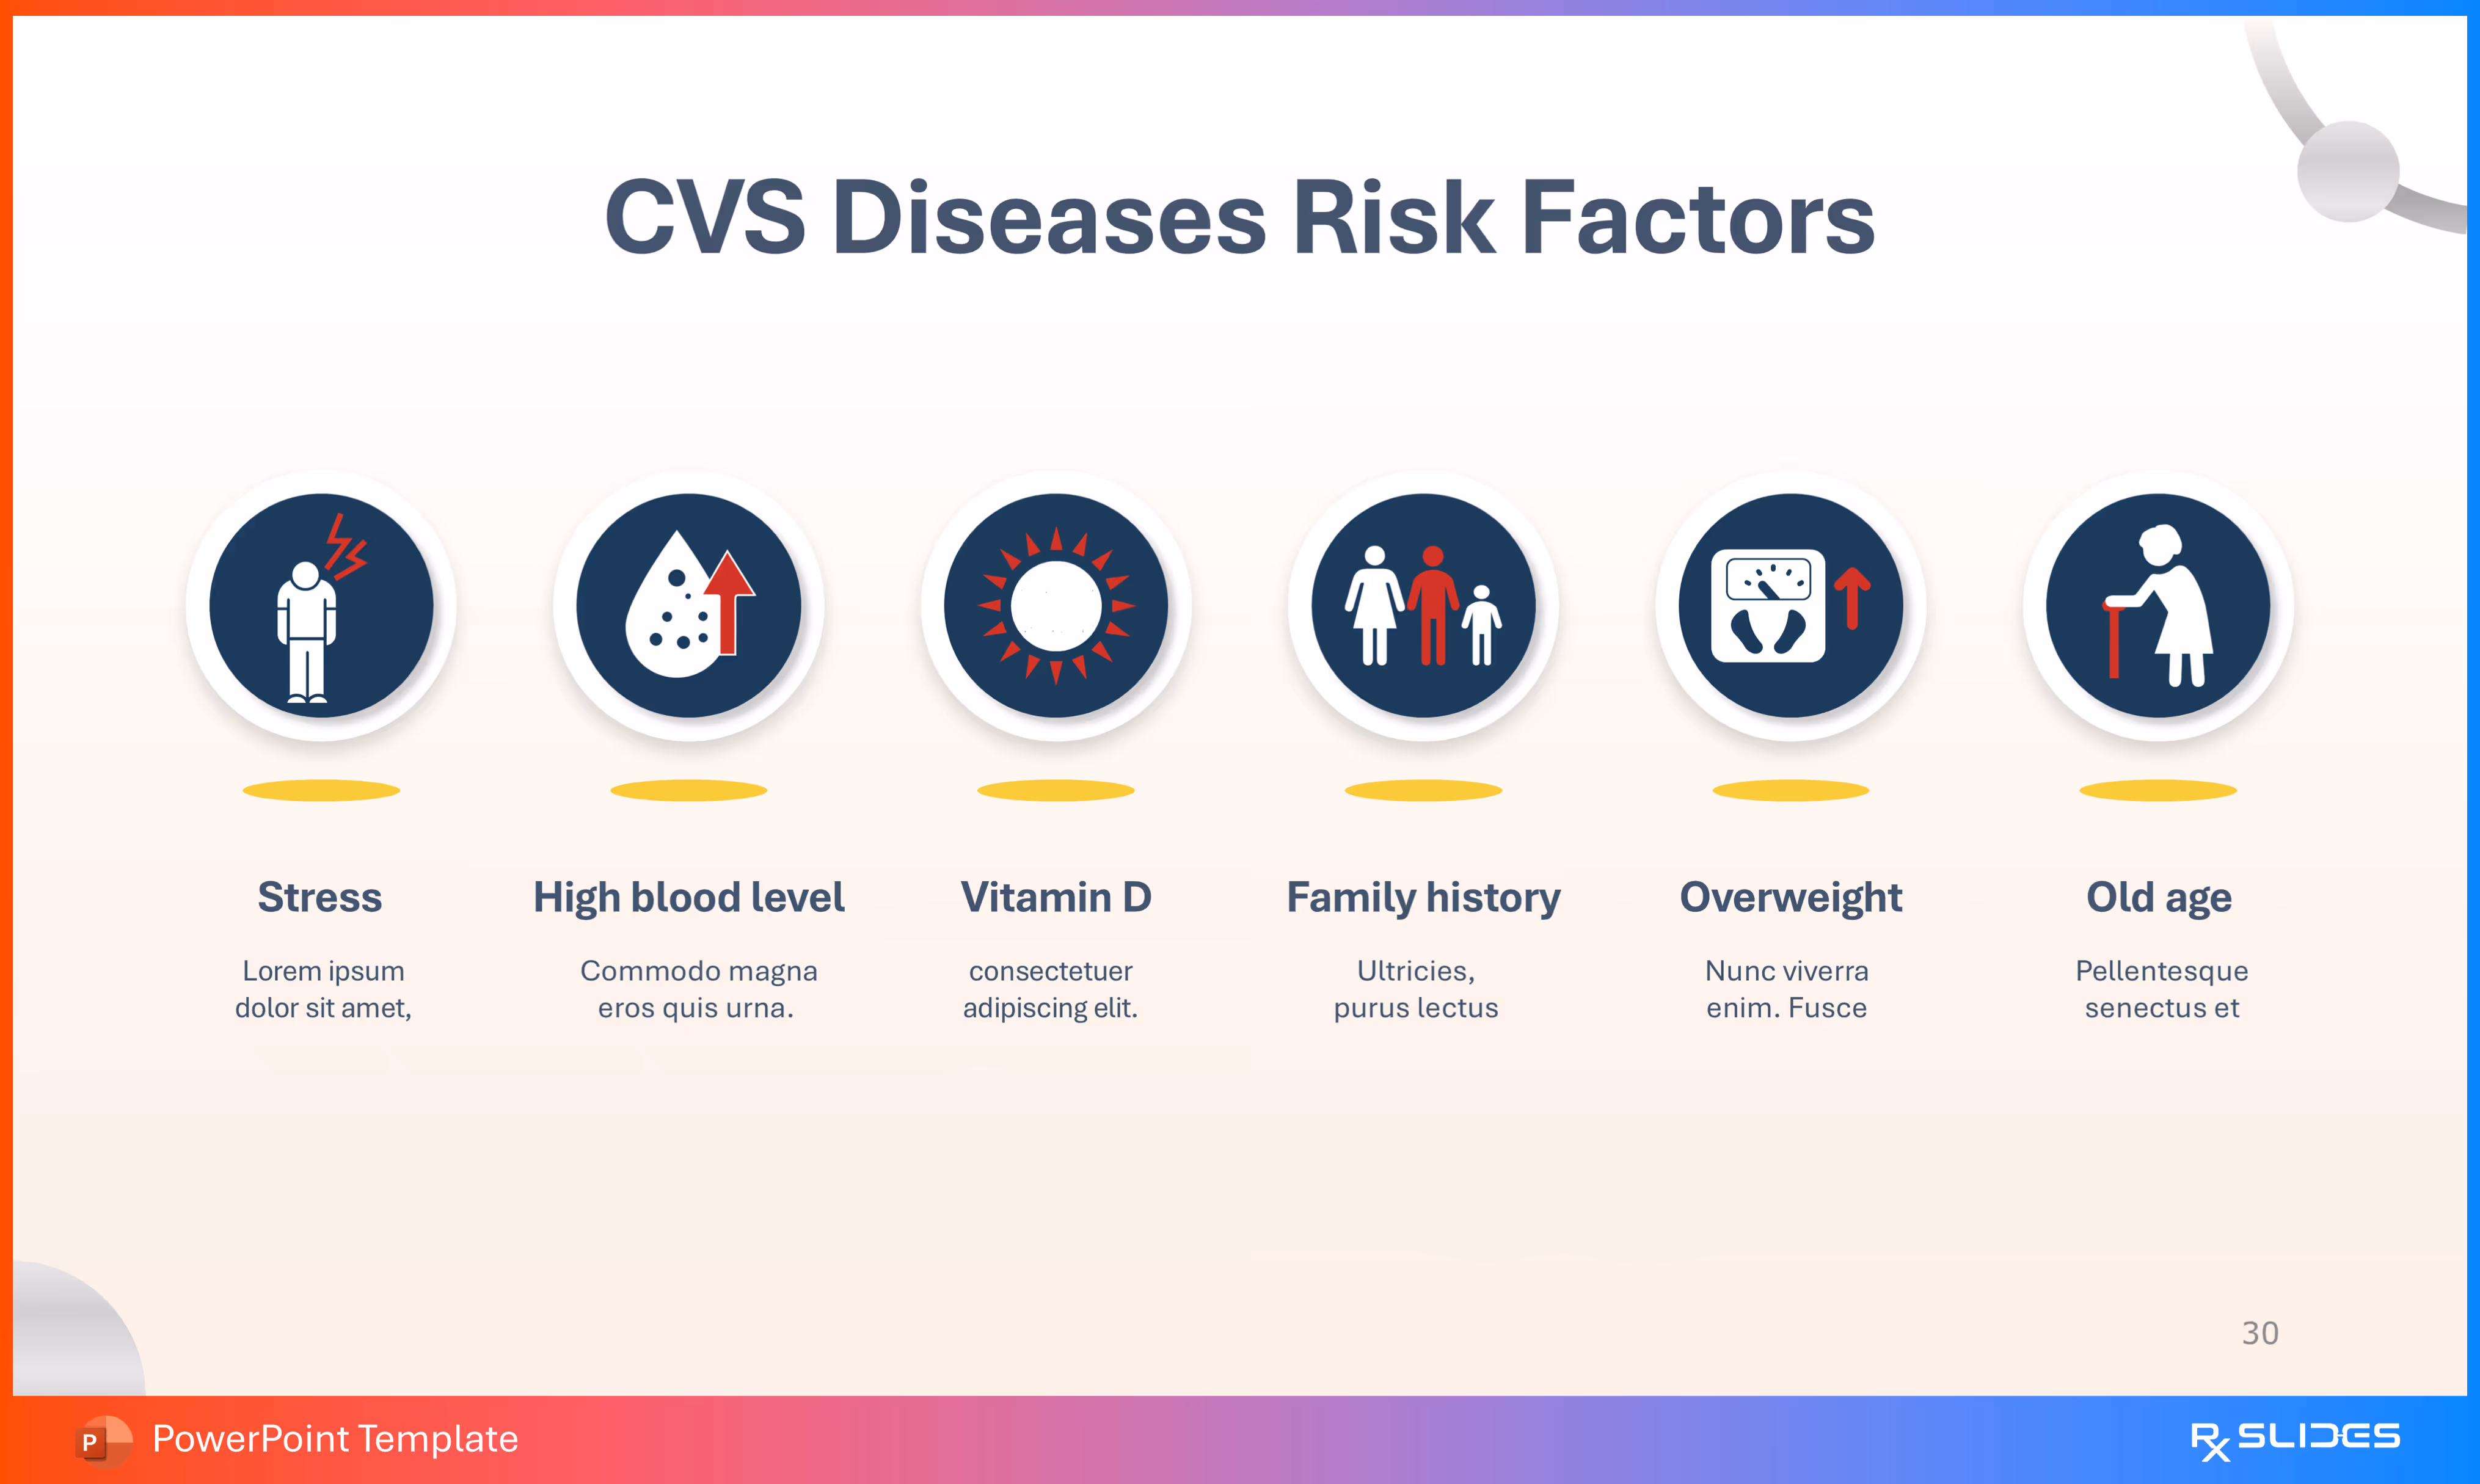
- This slide uses a 1x6 horizontal list format to present six key risk factors.
- Each risk factor is presented with a related icon (inside a circular badge) and placeholder text:
- Stress (Icon of a person with lightning bolts/stress lines).
- High blood level (Icon of a blood droplet with an upward arrow).
- Vitamin D (Icon of a sun/light source). (This likely refers to Vitamin D deficiency being a risk factor).
- Family history (Icon of a family group).
- Overweight (Icon of a scale/weight measuring device with an upward arrow).
- Old age (Icon of an elderly person with a cane).
Slide 31 - CVS Diseases Risk Factors (Continued)
.avif)
- This slide uses a horizontal list format to present four more key risk factors, continuing the enumeration from Slide 30.
- Each risk factor is presented with a related icon and placeholder text:
- High blood level: Icon of a blood droplet with an upward arrow.
- Family history: Icon of a family group.
- Overweight: Icon of a scale/weight measuring device with an upward arrow.
- Old age: Icon of an elderly person with a cane.
Slide 32 - CVS Diseases Symptoms (Section Divider)
.avif)
- The slide features a prominent circular icon containing an illustration of a person bent over with red, wavy lines above their head, commonly used to symbolize pain, shortness of breath, or distress.
- The design uses the red and dark blue tones of the template to clearly mark the beginning of the clinical symptom discussion.
Slide 33 - CVS Diseases Symptoms Detail
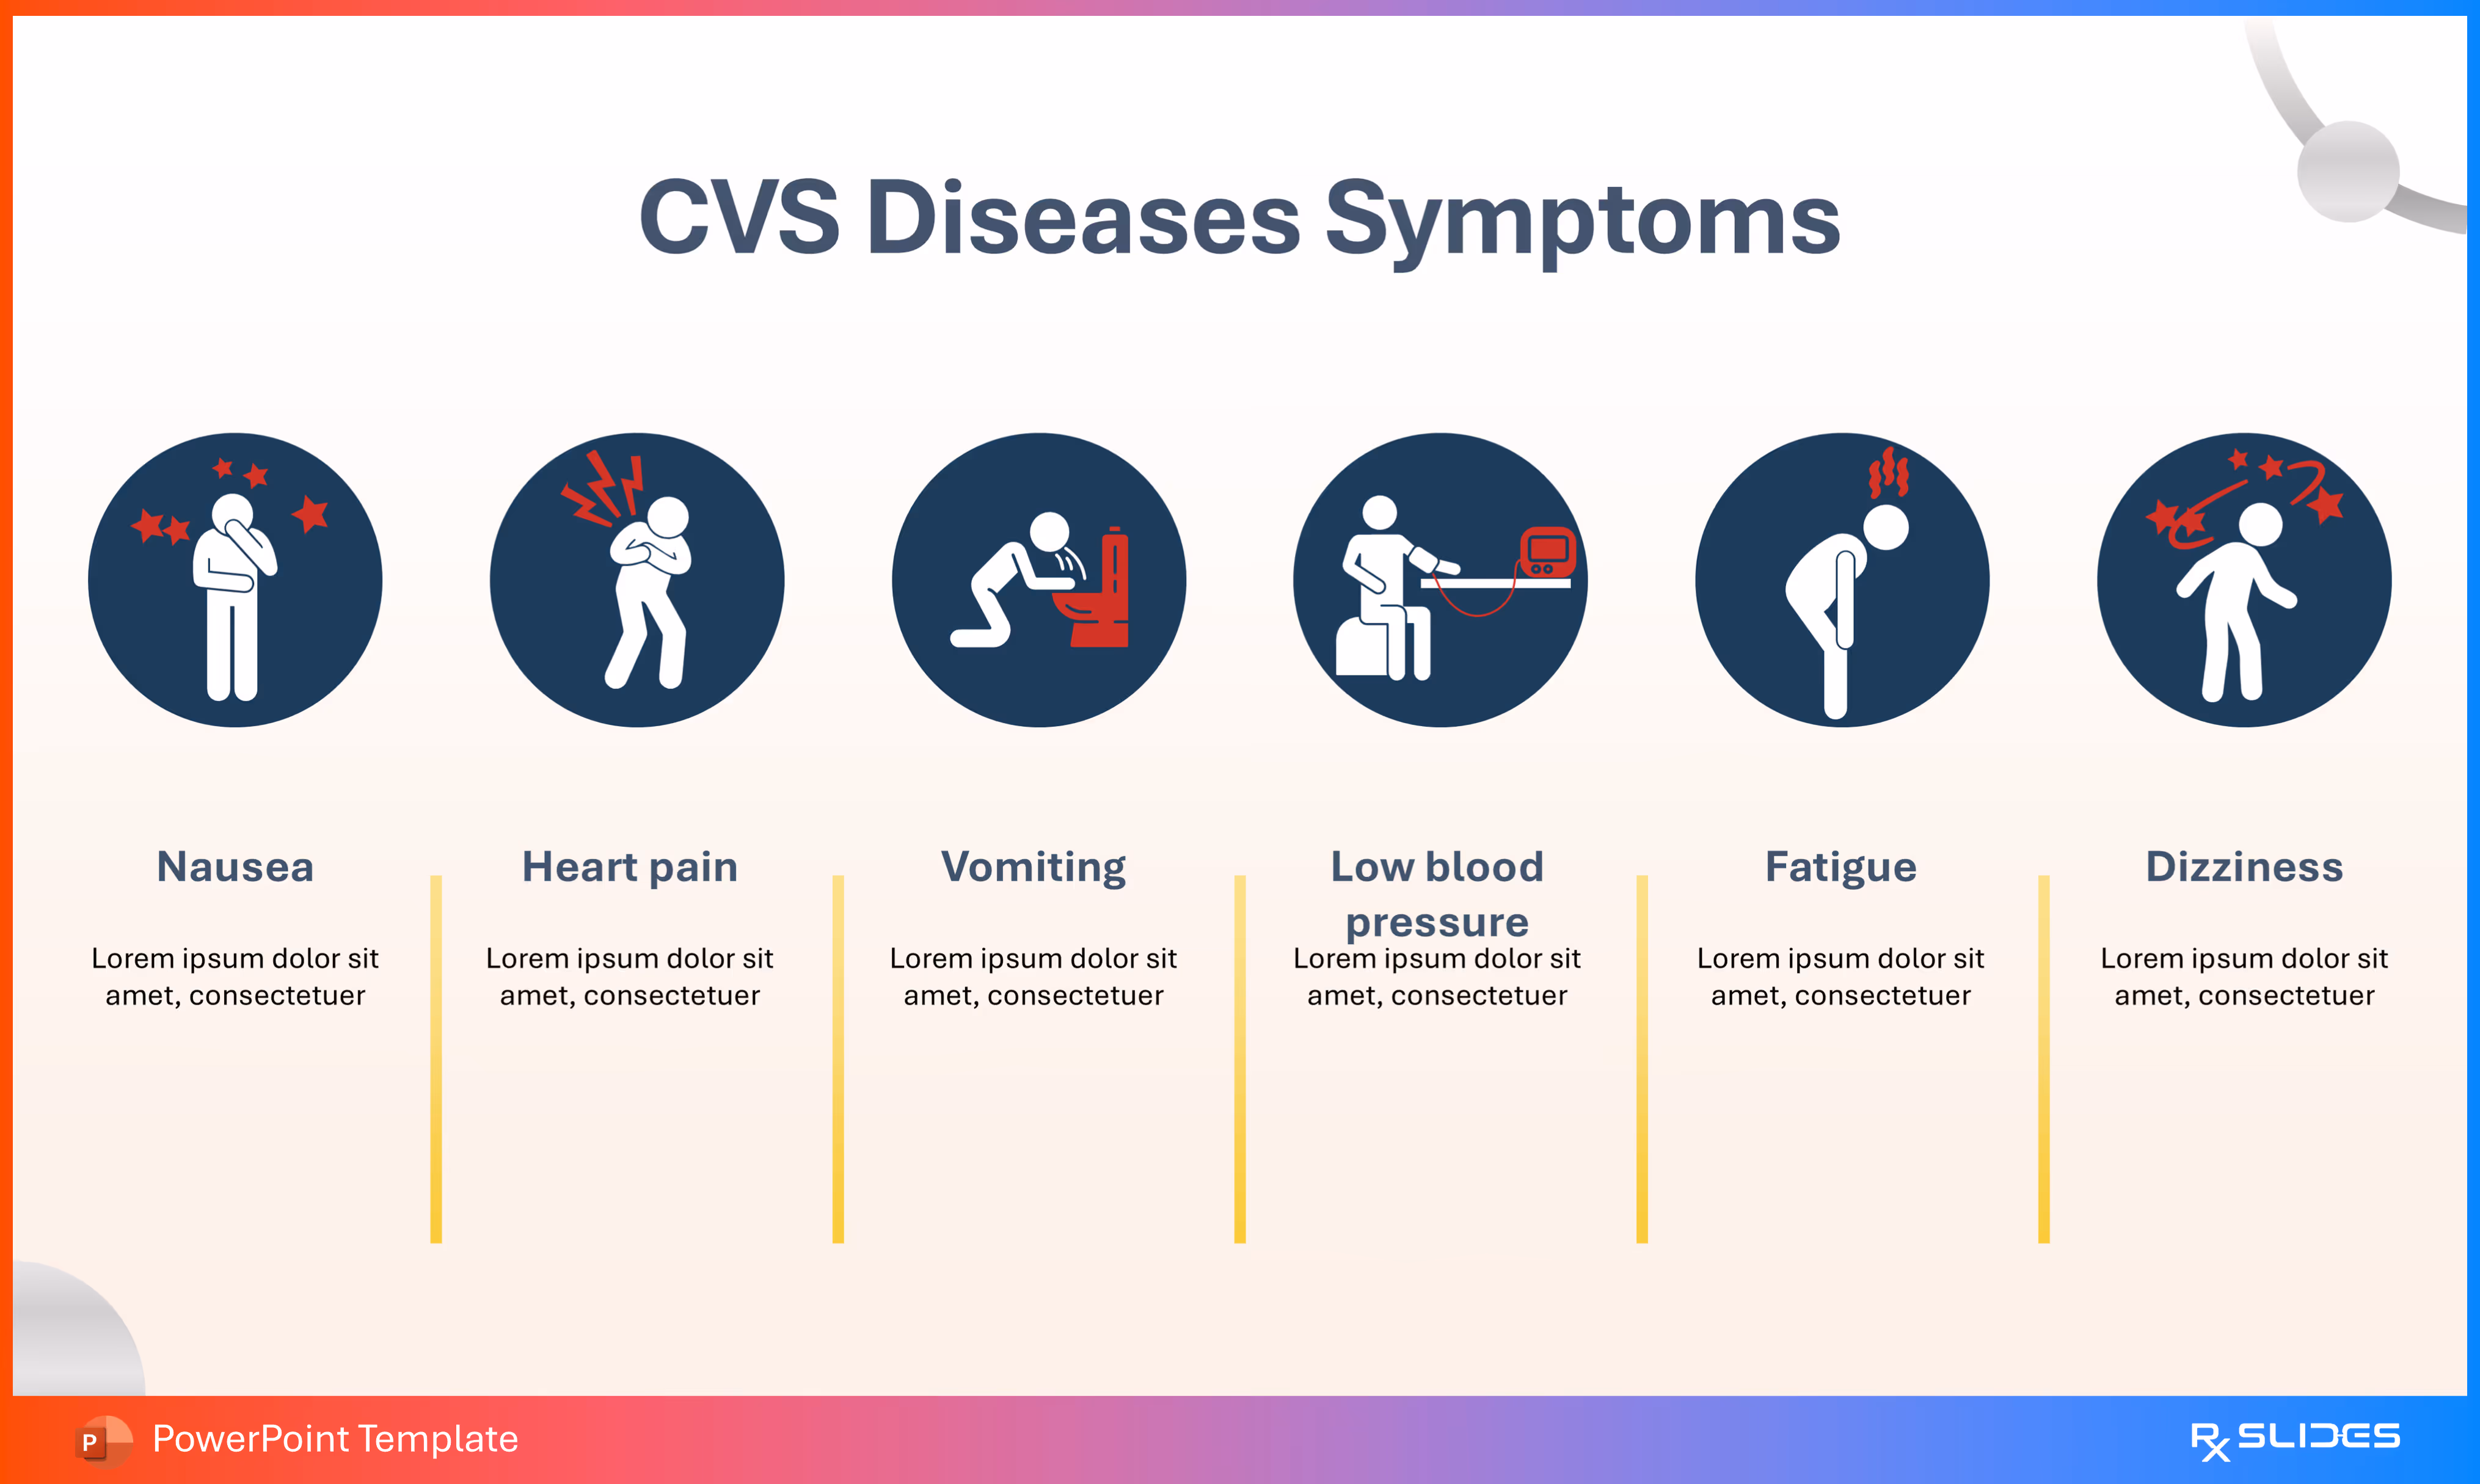
- This slide uses a clear 1x6 horizontal list format to present six key symptoms of cardiovascular diseases.
- Each symptom is presented with a related icon (inside a dark blue circular badge) and placeholder text below:
- Nausea (Icon of a person with stars/distress lines around the head).
- Heart pain (Icon of a person clutching their chest with lightning bolts).
- Vomiting (Icon of a person bent over a toilet).
- Low blood pressure (Icon of a person connected to a blood pressure monitor).
- Fatigue (Icon of a person bent over, possibly from exhaustion).
- Dizziness (Icon of a person staggering with stars/distress lines).
Slide 34 - CVS Diseases Symptoms (Alternative Layout)
.avif)
- This slide uses an alternating drop-pin/tear-drop design along a central horizontal line to list six key symptoms.
- The six symptoms, consistent with Slide 33, are listed in a different visual arrangement
- Each symptom is represented by a small white icon inside a large, dark blue, tear-drop shape. Placeholder text is included for descriptions.
Slide 35 - CVS Diseases Diagnosis (Section Divider)
.avif)
- The slide features a prominent circular icon containing an illustration of two test tubes and a blood droplet, symbolizing laboratory testing and diagnostics.
- The design uses the template's dark blue, red, and white scheme to clearly separate this clinical section on diagnosis.
Slide 36 - CVS Diseases Diagnosis Detail
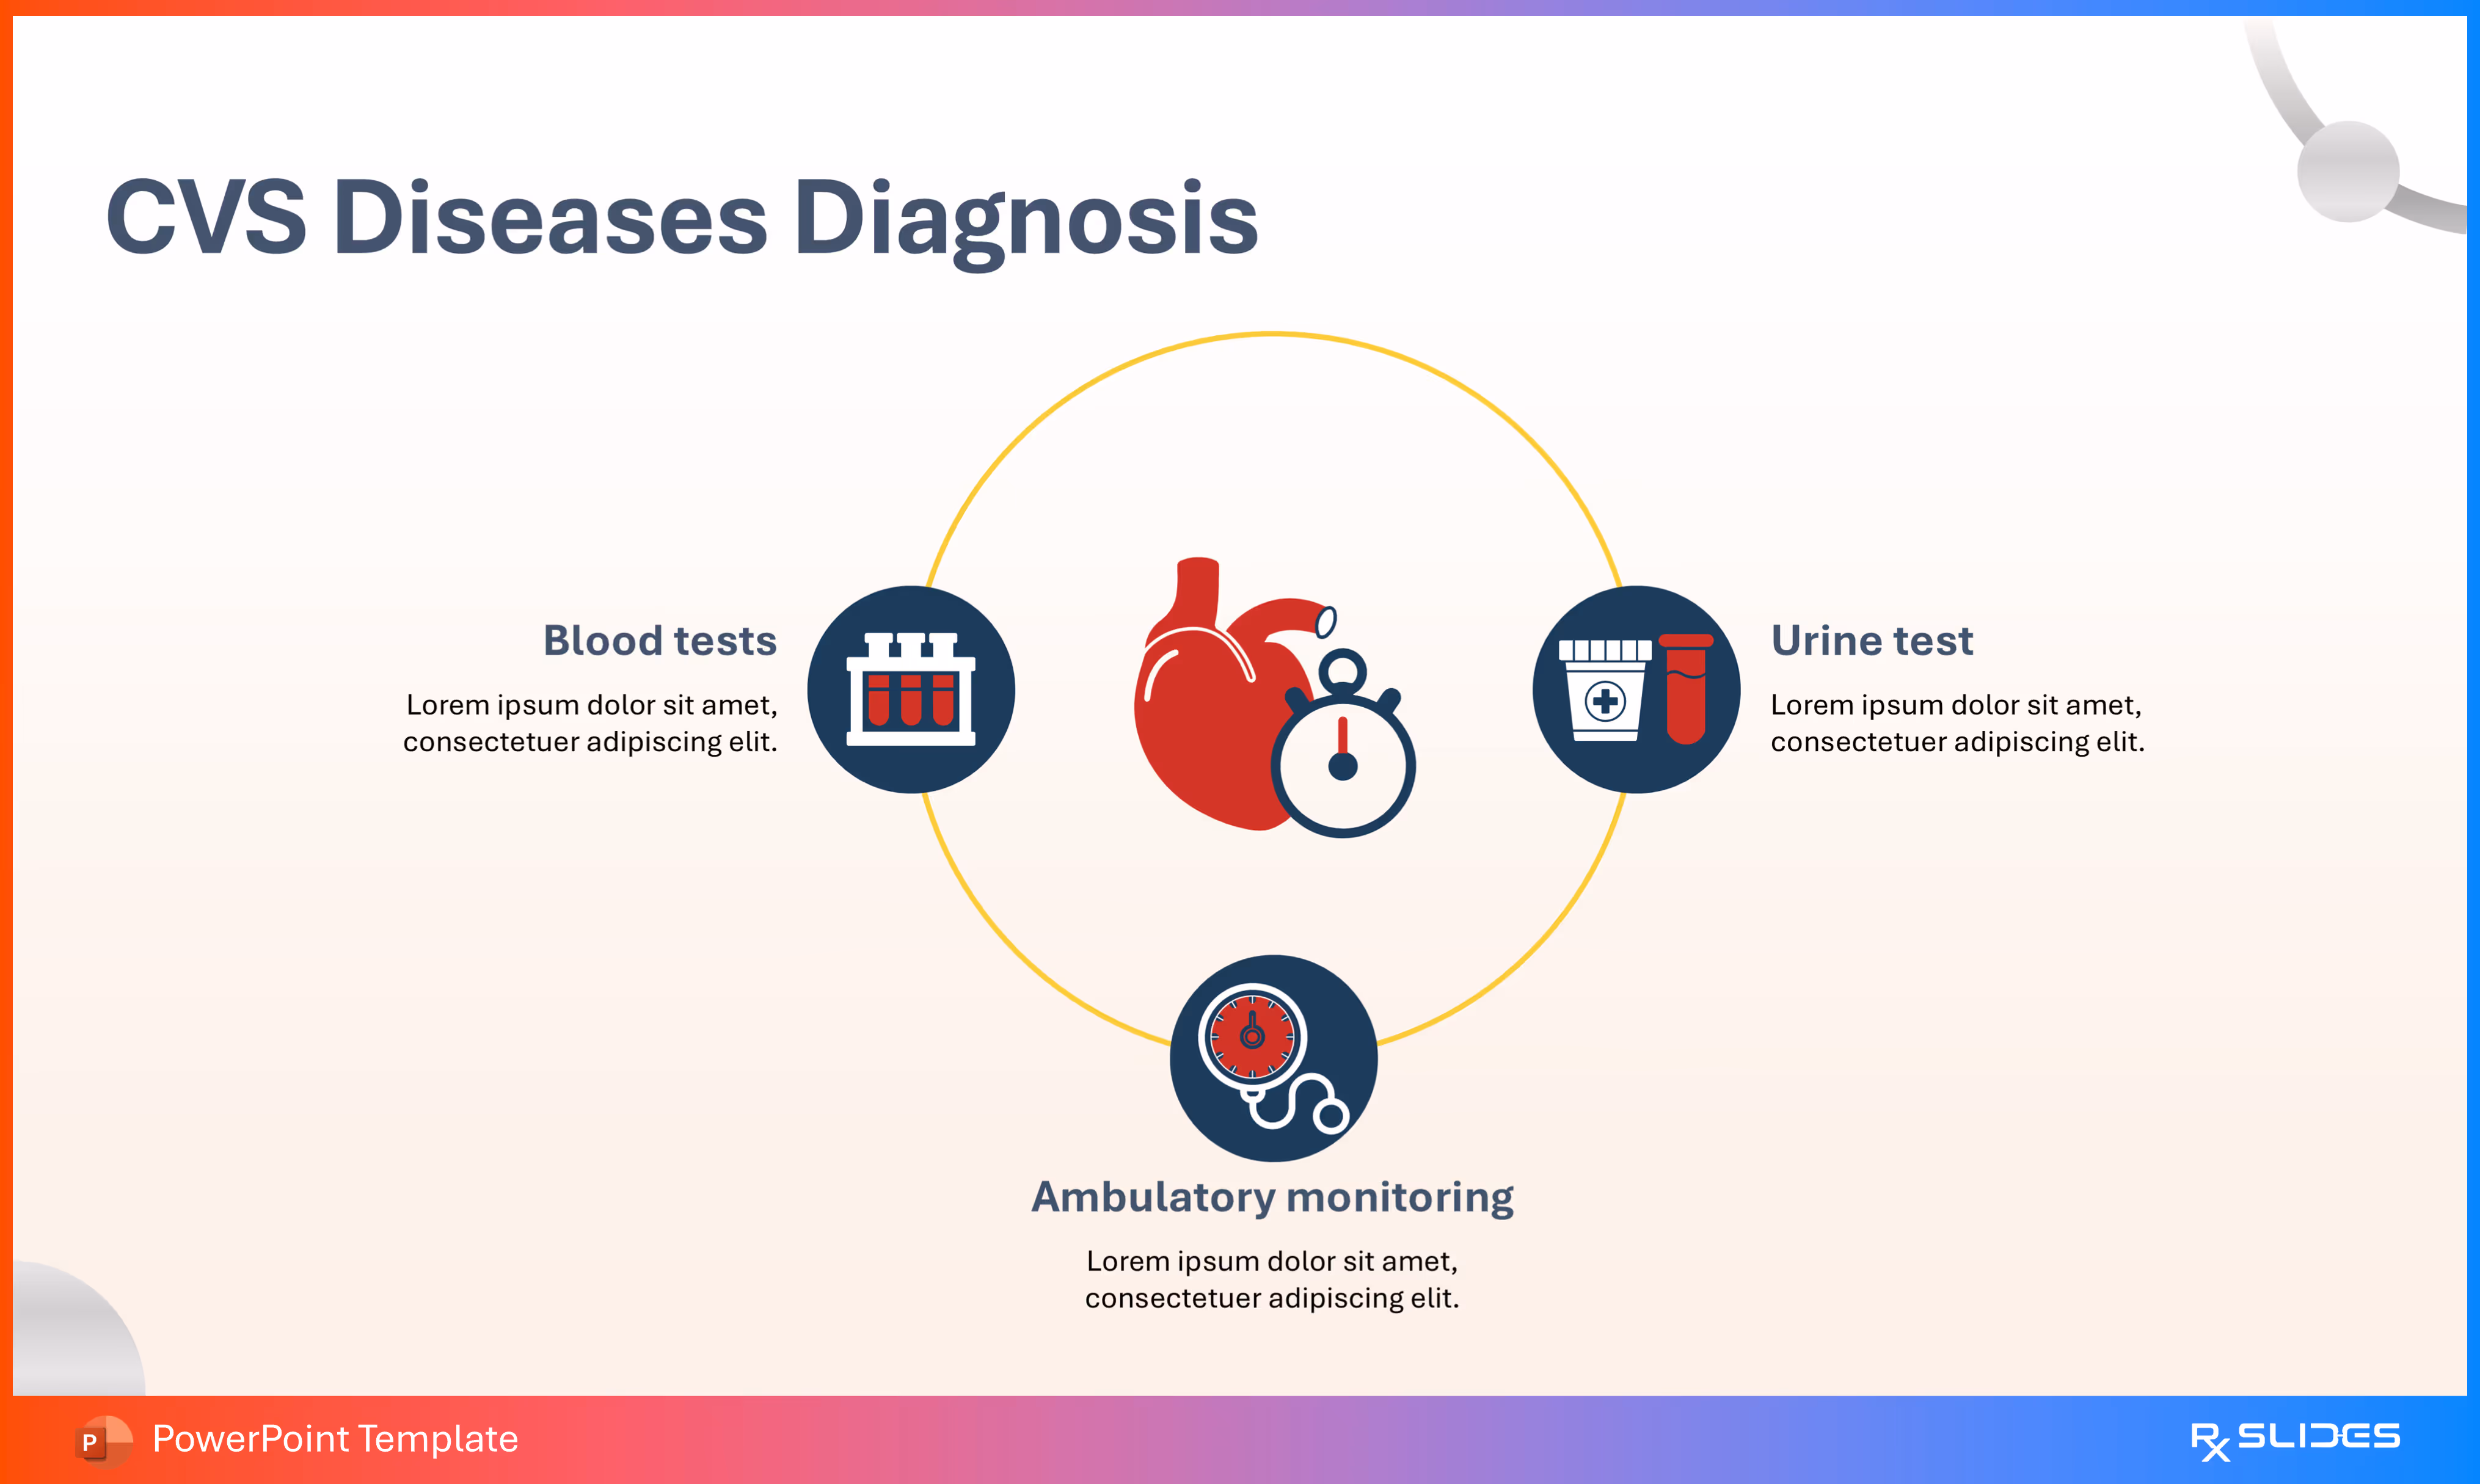
- The slide uses a circular arrangement around a central icon of a heart and a stopwatch (representing time-sensitive monitoring or heart rhythm).
- Three primary diagnostic methods are listed with icons and placeholder text:
- Blood tests: Icon of test tubes.
- Urine test: Icon of a test tube with a cross/plus sign.
- Ambulatory monitoring: Icon of a stopwatch/monitor and blood pressure cuff.
Slide 37 - CVS Diseases Diagnosis (Alternative Detail Layout)
.avif)
- This slide uses a vertical timeline/list for the diagnostic methods on the right, contrasted with a large illustration of the Cardiovascular System in the human body on the left.
- The three primary diagnostic methods are listed with icons and placeholder text:
- Blood tests: Icon of test tubes.
- Ambulatory monitoring: Icon of a stopwatch/monitor and blood pressure cuff.
- Urine test: Icon of a test tube with a cross/plus sign.
- Aesthetics: The vertical list is highlighted by a continuous yellow line, drawing attention to the text. The prominent background illustration emphasizes that the diagnostics relate to the entire body's circulatory network.
Slide 38 - CVS Diseases Complications (Section Divider)
.avif)
- The slide features a prominent circular icon containing an illustration of a stylized heart with a red circle/dot in the lower center, symbolizing a serious issue or localized defect.
- The design uses the template's dark blue, red, and white scheme to clearly separate this final pathology section on complications.
Slide 39 - CVS Diseases Complications Detail

- This slide uses a clear, four-column card layout to present four major systemic complications of cardiovascular diseases.
- Each complication is presented with a related icon (inside a dark blue circular badge) and placeholder text for a detailed description:
- Complication 1 (Brain): Icon of a brain with a red circle/dot, often symbolizing stroke.
- Complication 2 (Kidneys): Icon of a kidney with a red circle/dot, often symbolizing kidney failure.
- Complication 3 (Eyes): Icon of an eye with a red circle/dot, often symbolizing vision loss/retinopathy.
- Complication 4 (Heart): Icon of a heart with a red circle/dot, often symbolizing heart attack or heart failure.
Slide 40 - CVS Diseases Complications (Alternative Detail Layout)
.avif)
- This slide uses a 2x2 grid layout with prominent circular icons for the complications, allowing for a title and two blocks of text for each point.
- The four major systemic complications from Slide 39 are arranged in this new format
- This layout provides more space for text, making it ideal for a detailed discussion of the pathology and effects of CVS complications.
Slide 41 - CVS Diseases Treatment (Section Divider)
.avif)
- The slide features a prominent circular icon containing an illustration of a medicine bottle and two pills with a cross/plus sign, symbolizing medical intervention and pharmacology.
- The design uses the template's dark blue, red, and white scheme to clearly separate this major clinical section on treatment options.
Slide 42 - CVS Diseases Treatment Detail
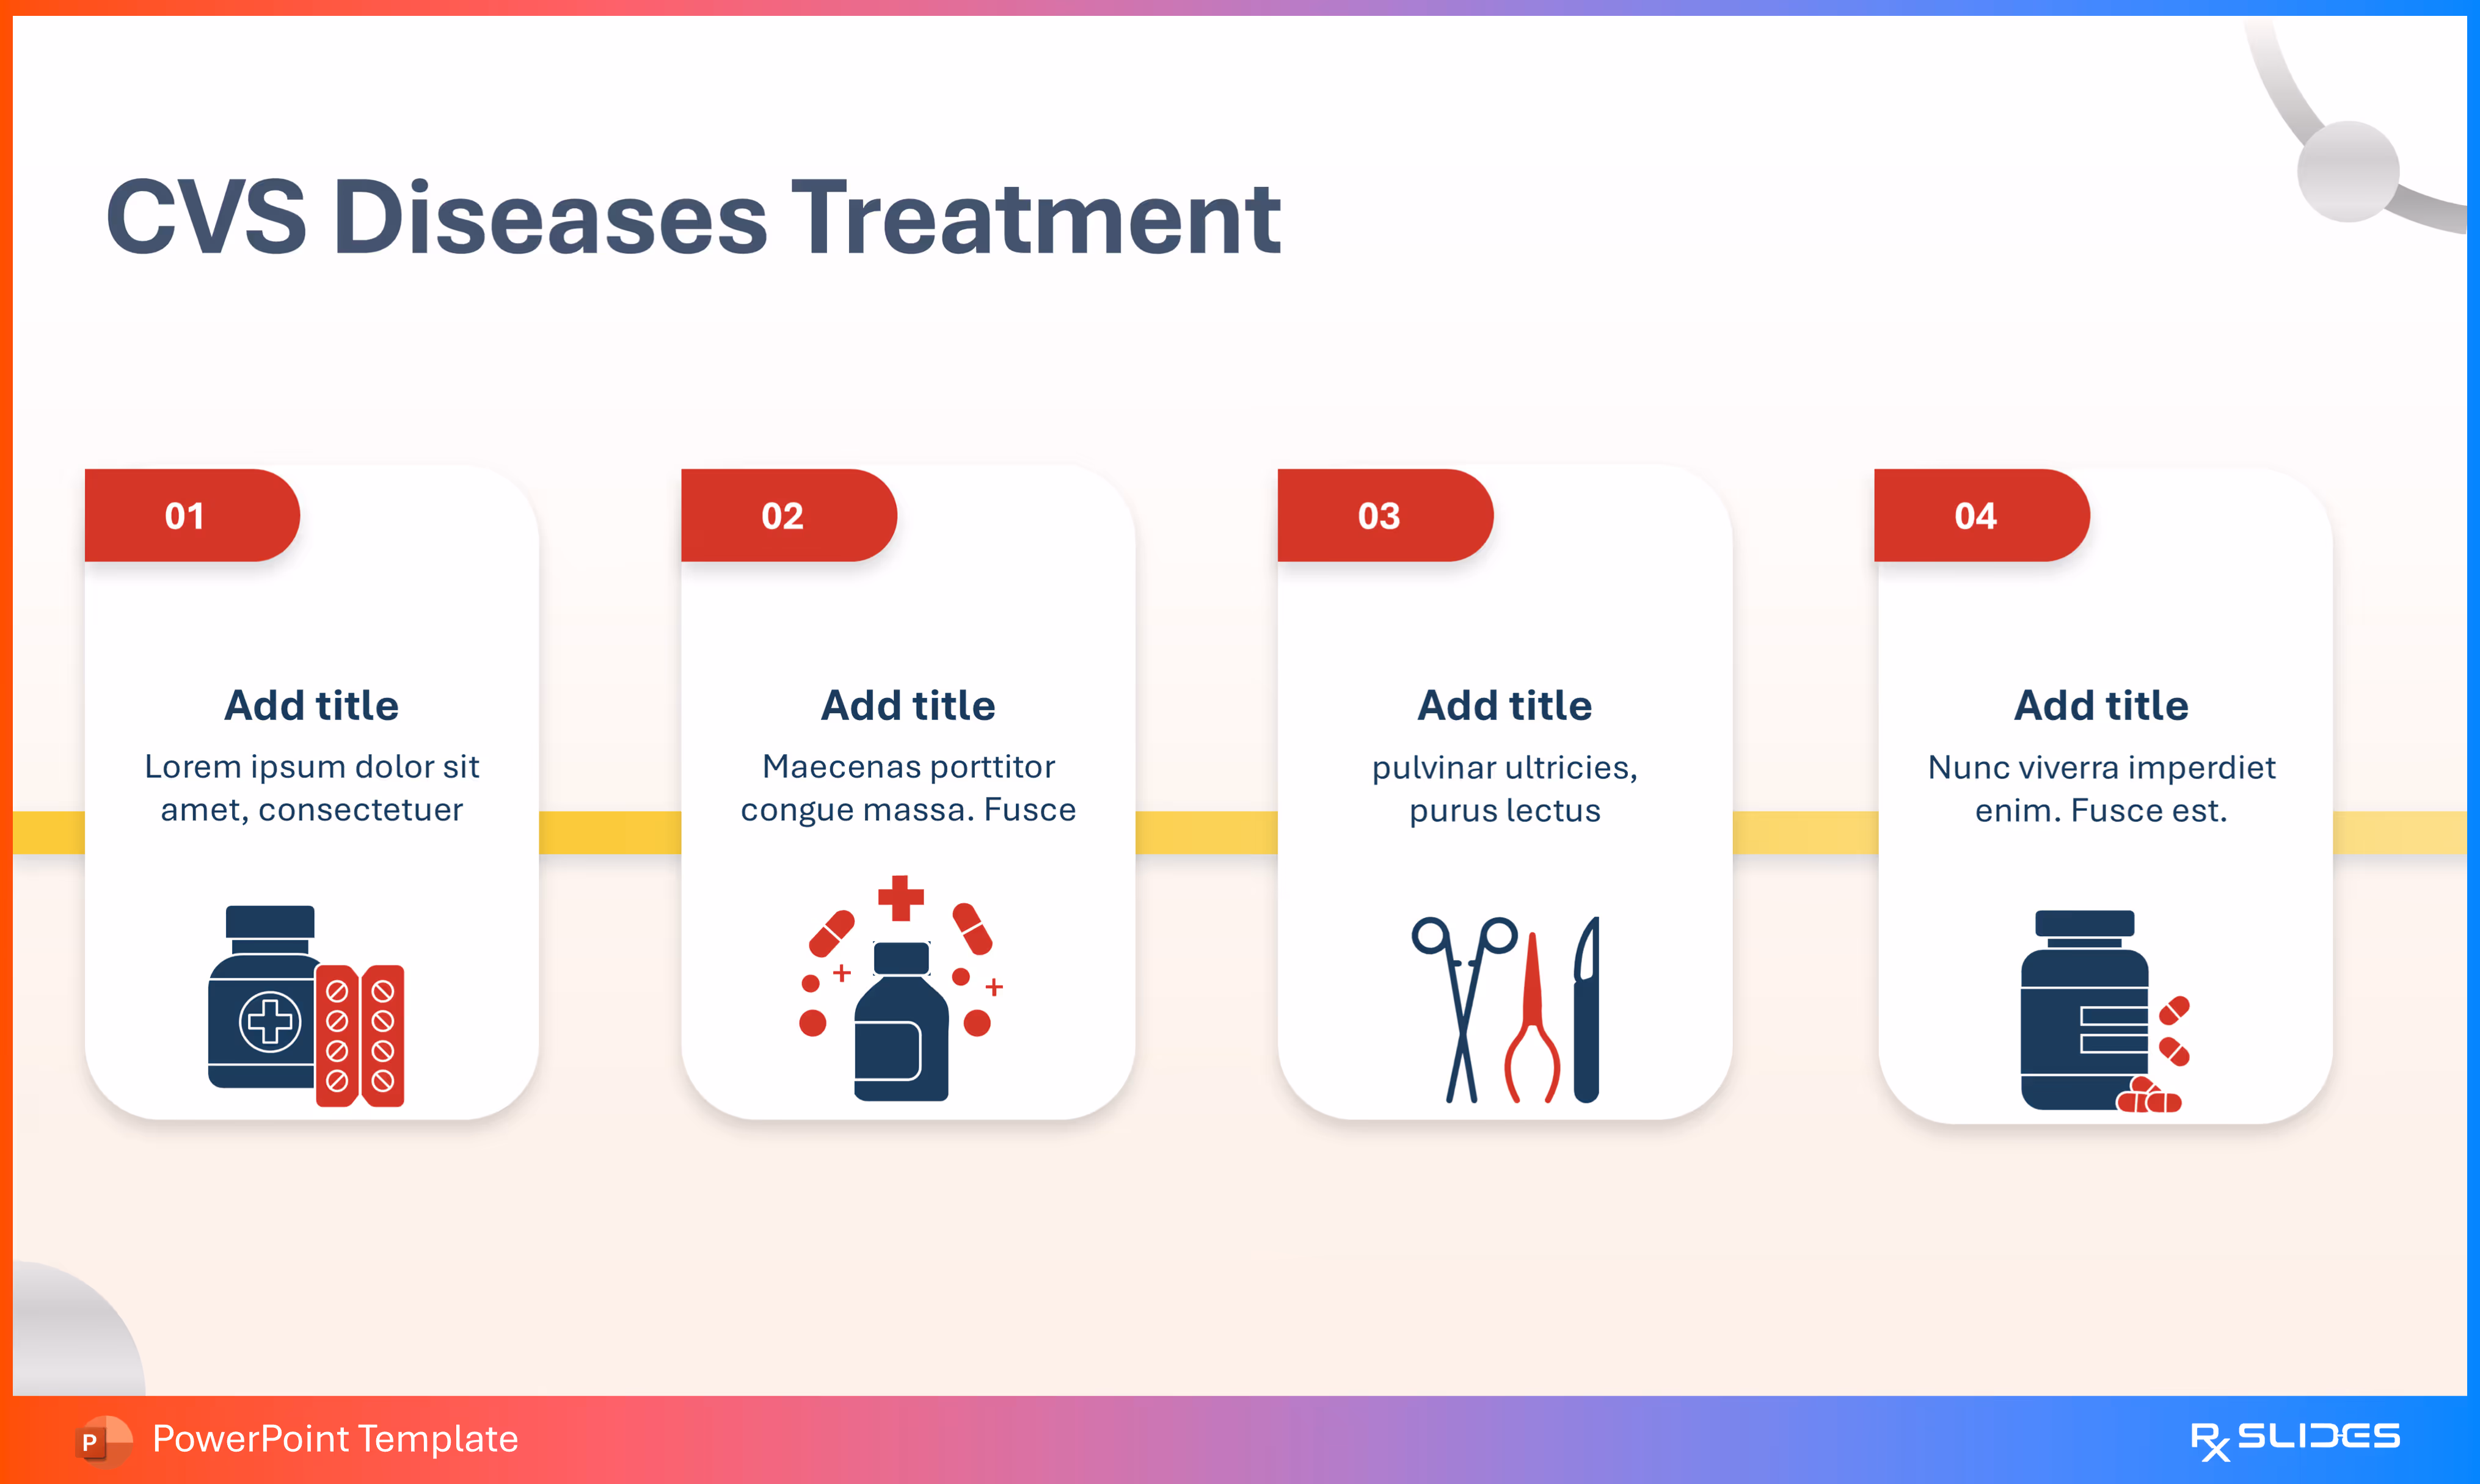
- This slide uses a clear, numbered four-step process with large, dedicated icons to outline different treatment modalities.
- Content Sections (Treatment Modalities): Each treatment card has a large number (01 to 04), an icon, a placeholder title, and a description area:
- Treatment 1 (Medical): Icon shows a medicine bottle and a pill blister pack, indicating drug therapy.
- Treatment 2 (Medical/Drug): Icon shows a medicine bottle and scattered pills, indicating an alternative or follow-up drug regimen.
- Treatment 3 (Surgical): Icon shows surgical instruments (scissors, scalpel), indicating surgical intervention.
- Treatment 4 (Maintenance): Icon shows a large medicine bottle with scattered pills, possibly representing long-term management or chronic medication.
Slide 43 - CVS Diseases Treatment (Alternative Detail Layout)
.avif)
- This slide uses a circular/pie-chart diagram with six distinct segments radiating from a central title circle, allowing for a comprehensive presentation of treatment options.
- Content Sections (Treatment Modalities): Six treatment modalities are presented with icons and dedicated text boxes:
- Segment 1 (Medication): Icon shows a pill blister pack and a bottle.
- Segment 2 (Drug Therapy): Icon shows a bottle with scattered pills.
- Segment 3 (Surgery): Icon shows surgical instruments (scissors, scalpel).
- Segment 4 (Medication/Long-term): Icon shows a medicine bottle with pills.
- Segment 5 (Unknown/Medication): Icon shows a medicine bottle and pills (similar to others).
- Segment 6 (Unknown/Pills): Icon shows a pill bottle.
Slide 44 - Thank you (Final Slide)
.avif)
- The slide uses a large, simplified illustration of the entire Cardiovascular System on the right side of a human figure.
- The design is clean, with minimal text, allowing the focus to remain on the visual and the final message. The use of the full system diagram emphasizes the comprehensive nature of the preceding presentation.
Features of the Template
- 100% editable PowerPoint template.
- Editable colors, you can change according to your presentation style and company branding guidelines.

.avif)