Pancreatic Cancer PowerPoint Template

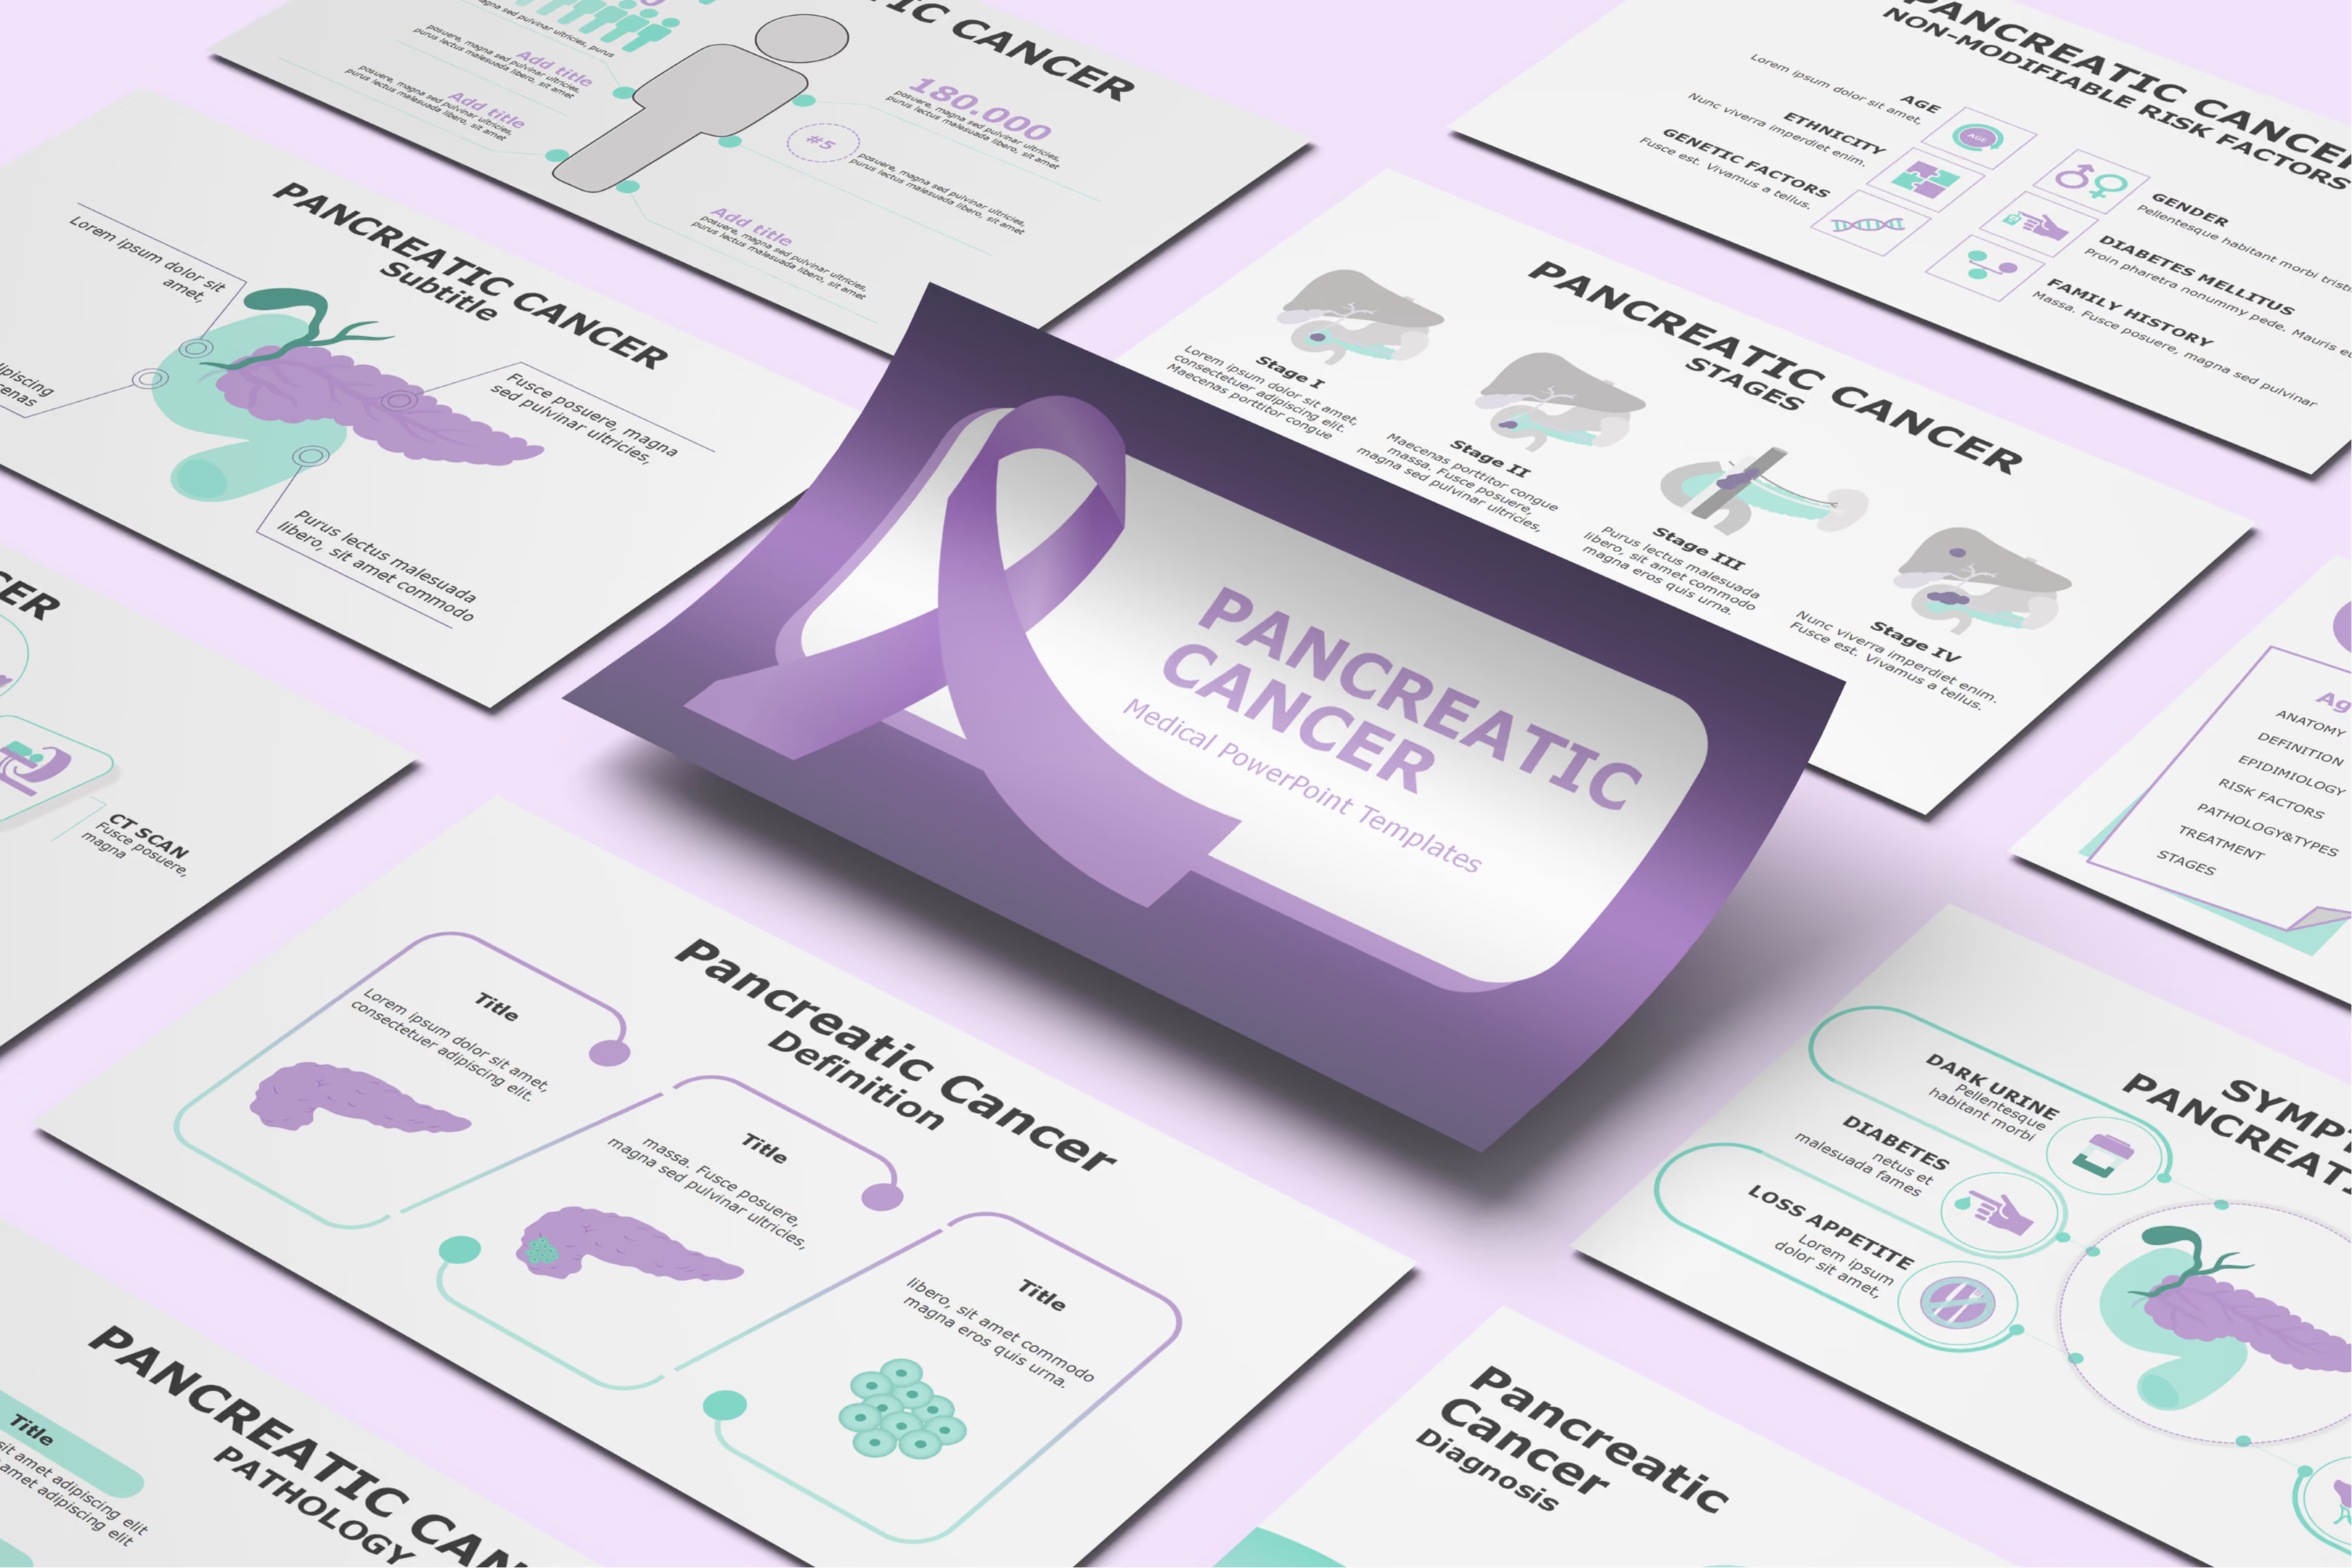




Template Preview
Designed for healthcare professionals creating clear and structured medical presentations.
Ideal for doctors, medical educators, and pharmaceutical teams preparing lectures, clinical education, product presentations, and training.
Fully editable in PowerPoint, allowing you to customize diagrams, charts, and slide layouts with your own medical content
Ready-to-use presentation structure that saves time and helps you build professional healthcare presentations quickly.
Fully Animated
Built-in animations help you present medical information clearly and make complex concepts easier to understand.
Editable Colors and Shapes
Editable colors and shapes help you easily customize the slides to match your content and presentation style, just drag and drop your content.
Professional medical layouts
Professional medical layouts help you organize clinical information, medical data, and treatment insights in a clear and structured way.

Created by Medical Professionals
This template prioritizes medical accuracy, clarity, and real-world usability. Each slide is designed with a medical audience in mind, helping you present clinical information, data, and treatment insights in a way that is structured, credible, and easy for healthcare professionals to understand.
Medical Training for Pharmaceutical & Life Sciences Companies
Medical Affairs and Training teams building oncology onboarding content can draw on this animated, 180-plus slide Pancreatic Cancer template to cover pancreatic anatomy, pancreatic ductal adenocarcinoma pathology, TNM staging, and the diagnostic role of CA 19-9, endoscopic ultrasound, and ERCP. New oncology sales trainees and Medical Science Liaisons get a visual foundation for surgical options such as the Whipple procedure alongside chemotherapy, targeted therapy, and immunotherapy, all illustrated with animated vectors rather than static diagrams. Because the slide library already spans disease overview through treatment, trainers can adapt sections to their own onboarding schedule instead of building oncology visuals independently. New hires complete training with a working vocabulary for pancreatic oncology conversations.

Medical Congress & Scientific Conference Presentations
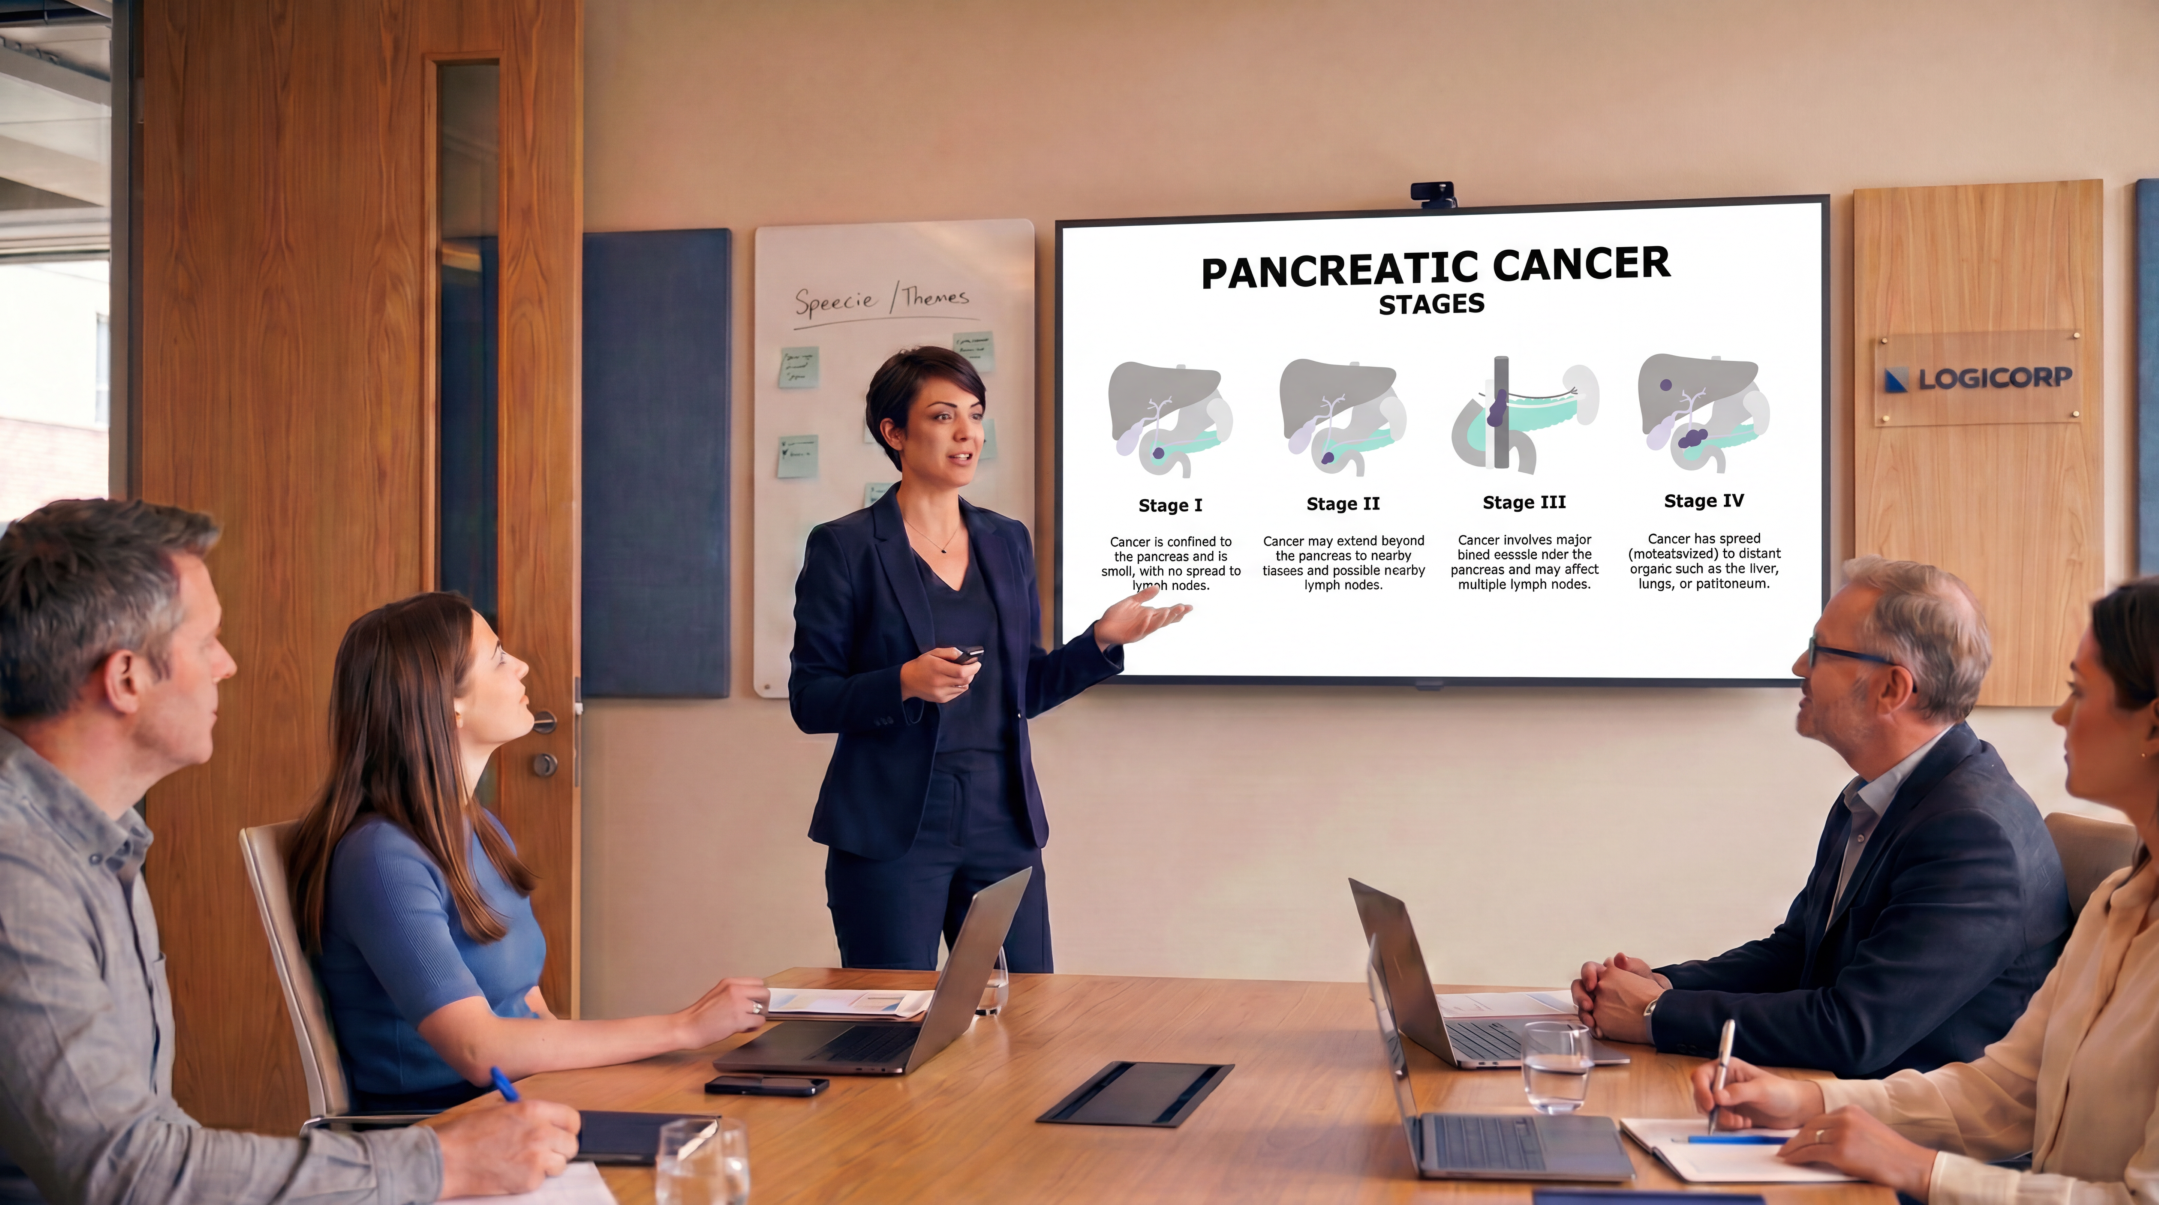
Medical oncologists, surgical oncologists, and hepatobiliary surgeons preparing a tumor board presentation or conference talk can adapt this animated template rather than assembling pancreatic anatomy and staging visuals for each new session. The prevalence charts, comparing pancreatic cancer rates by sex and geography, give speakers dummy data structured for a quick swap to their own institutional statistics. Diagnosis and treatment slides covering EUS, ERCP, and the Whipple procedure support a detailed technical discussion for a specialist audience, while the infographic set helps translate complex staging information for a mixed academic and clinical audience. A Key Opinion Leader presenting at multiple oncology meetings can reuse the same visual library across sessions of varying depth.
Pharmaceutical Product & Medical Affairs Presentations
Medical Affairs and Medical Communications teams supporting an oncology product can use this presentation as disease-state groundwork for scientific exchange, covering PDAC pathophysiology, TNM staging, and treatment classes including chemotherapy, targeted therapy, and immunotherapy without referencing a specific brand. Medical Science Liaisons can deliver the customized, animated slides at advisory boards or KOL scientific discussions to build shared clinical context before any product-specific data is introduced. Because the template stays disease-focused, it functions as a starting point still subject to the customer's own medical and compliance review ahead of any field use. Oncology teams gain a consistent, scientifically accurate reference across multiple therapeutic conversations.

eLearning & SCORM Training Modules
Learning & Development teams building oncology training for new fellows or infusion nursing staff can customize this Pancreatic Cancer template with their own case studies and assessment questions, then convert the finished presentation into a SCORM-compliant module for their learning management system when a self-paced course is the better format. The animated staging and treatment-pathway slides translate well into interactive checkpoints within an e-learning course. When a program needs a different scope, for example a diagnosis-focused refresher versus a full disease overview, the RxSlides team can adjust the template's depth and branding accordingly. A fully custom presentation can also be designed from scratch for training needs that fall outside any existing template.
Medical & Healthcare Education
Medical school and pharmacy faculty teaching oncology can use this animated template to walk students through pancreatic anatomy and the pathological progression of ductal adenocarcinoma without building illustrations independently. The template's infographics simplify complex staging and treatment-pathway information, helping students connect the TNM classification system to real diagnostic and surgical decision-making. Coverage of the Whipple procedure and adjuvant chemotherapy gives instructors a visual anchor for discussing multidisciplinary cancer care. Students gain a clearer picture of how diagnosis, staging, and treatment selection fit together in pancreatic oncology.
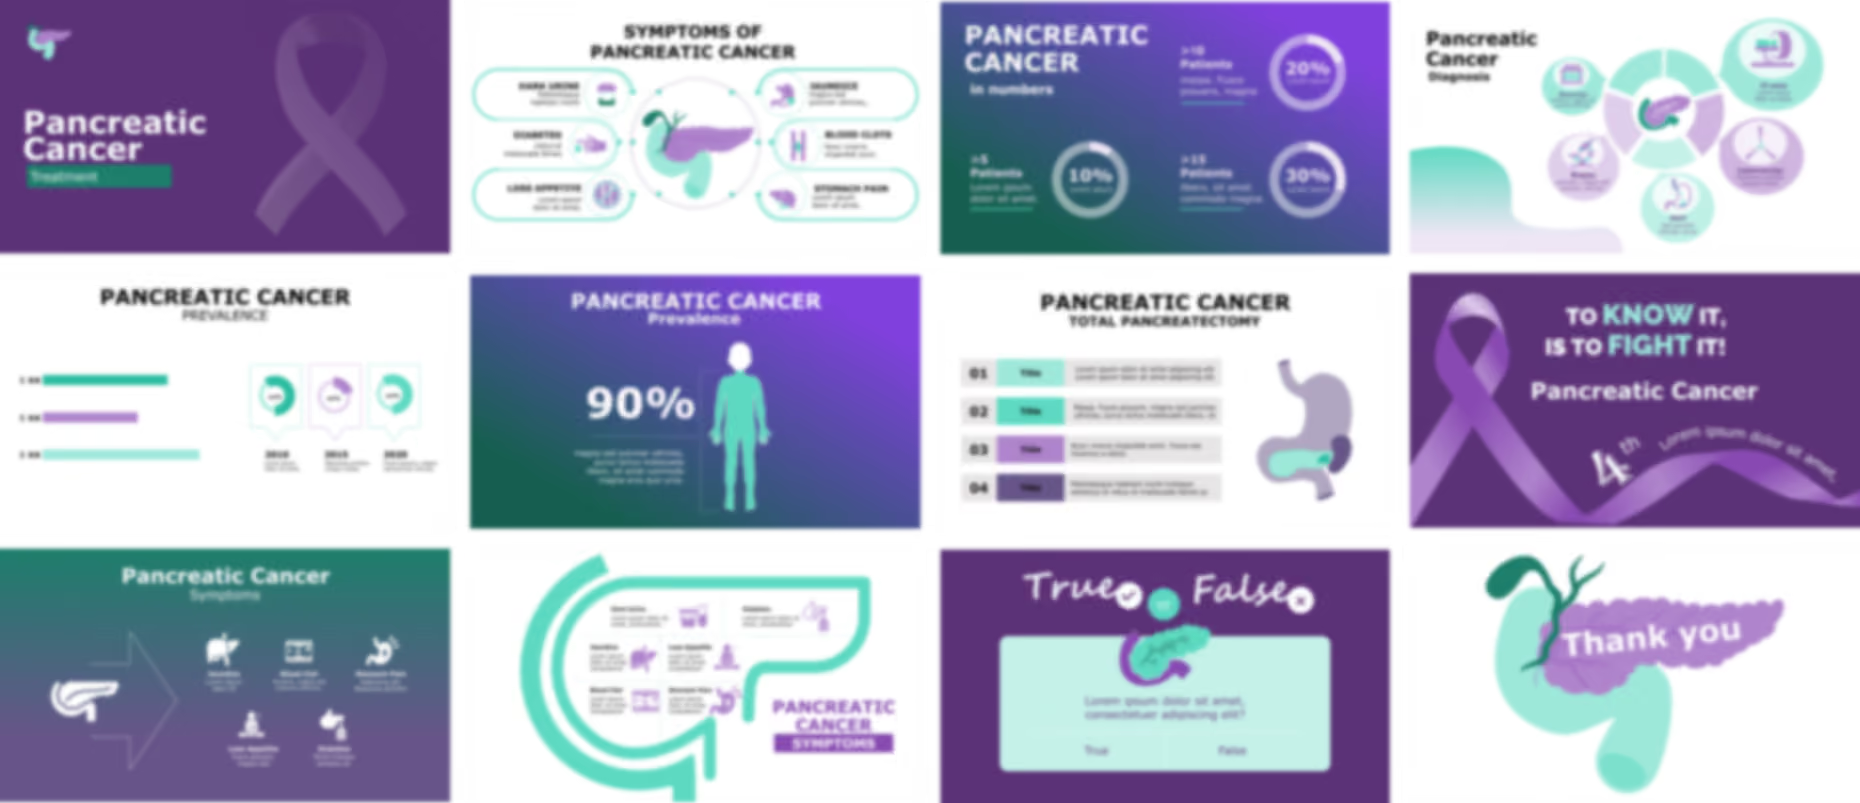
The Pancreatic Cancer PowerPoint template opens with cover slides featuring the violet pancreatic cancer awareness ribbon and an animated agenda before illustrations detail pancreatic anatomy, including the gallbladder, head, tail, duodenum, pancreatic duct, and pancreatic body. A definition slide then frames the disease for further customization with related animated vectors.
A series of animated slides visualizes the pathology of pancreatic carcinoma, illustrating cellular transformation and neoplastic migration into the bloodstream. Establishing this mechanism first gives educators a shared reference point before the presentation stages the disease's progression across a timeline layout.
Editable charts and graphs present prevalence data comparing male and female rates and country level figures, ready for your own statistics. Animated icons then illustrate symptoms including diabetes, dark urine, jaundice, stomach pain, blood clots, and loss of appetite.
The template outlines diagnostic methods including blood tests, biopsy, laparoscopy, ERCP, and CT scan through a combination of text and animated vectors before further slides detail treatment options with accompanying icons for each approach. A closing set of editable infographics and medical icons supports customizing the presentation to a specific audience.
Ready To Transform Your Presentation ?
Pay once, use forever