Chronic kidney Disease PowerPoint Template





Template Preview
Designed for healthcare professionals creating clear and structured medical presentations.
Ideal for doctors, medical educators, and pharmaceutical teams preparing lectures, clinical education, product presentations, and training.
Fully editable in PowerPoint, allowing you to customize diagrams, charts, and slide layouts with your own medical content
Ready-to-use presentation structure that saves time and helps you build professional healthcare presentations quickly.
Fully Animated
Built-in animations help you present medical information clearly and make complex concepts easier to understand.
Editable Colors and Shapes
Editable colors and shapes help you easily customize the slides to match your content and presentation style, just drag and drop your content.
Professional medical layouts
Professional medical layouts help you organize clinical information, medical data, and treatment insights in a clear and structured way.

Created by Medical Professionals
This template prioritizes medical accuracy, clarity, and real-world usability. Each slide is designed with a medical audience in mind, helping you present clinical information, data, and treatment insights in a way that is structured, credible, and easy for healthcare professionals to understand.
Medical Training for Pharmaceutical & Life Sciences Companies
The template's animated nephron anatomy, walking through the glomerulus, proximal and distal tubules, and collecting duct, gives nephrology-focused sales teams a ready anchor for CKD onboarding before symptoms enter the discussion. Representatives study the hypertension- and diabetes-driven pathogenesis pathways, including mesangial cell changes and efferent arteriole narrowing, before they are cleared to hold promotional conversations with nephrologists and internal medicine physicians. The GFR-based staging content and dialysis-versus-medication treatment overview give trainers a scientifically grounded baseline without needing a renal illustrator on staff. Field readiness comes faster when new hires already understand the mechanism before memorizing the guideline-driven treatment ladder.

Medical Congress & Scientific Conference Presentations
The template's animated hypertension-and-diabetes pathogenesis sequence saves nephrologists and internal medicine Key Opinion Leaders from sourcing separate mechanism diagrams for each comorbidity when building a renal congress session. A medical professor lecturing on diagnostic workup can adapt the imaging, blood test, urine test, and biopsy content to build a structured case discussion. The stage-by-stage progression infographic gives a clinical case presentation a clear visual anchor before the conversation turns to dialysis and renal replacement options. Because the anatomy and pathogenesis content already carries scientific weight, the presenter's own case data becomes the centerpiece rather than the background research.

Pharmaceutical Product & Medical Affairs Presentations
The template's pathogenesis and staging slides give Medical Affairs teams supporting a nephrology or cardio-renal portfolio a ready framework for positioning a therapy within CKD's hypertension-, diabetes-, or autoimmune-driven progression. Medical Science Liaisons use the resulting materials in scientific exchange with nephrologists, referencing the same GFR staging and complication data those clinicians already apply in practice. Since the causes, treatment, and prevention content is organized separately, Medical Affairs can shift emphasis toward a specific renal-protective therapy class without commissioning new anatomical artwork. Promotional review stays entirely with the customer; the template only supplies the accurate scientific starting point.

eLearning & SCORM Training Modules
Institution-specific dialysis protocols and patient cases turn this CKD template into customized coursework for nephrology nurse educators and instructional designers, who can then optionally convert the finished presentation into a SCORM-compliant module for nursing staff or renal fellows on an LMS. The unedited template functions as a reference library rather than a classroom-ready course. Because the anatomy, staging, and treatment content already follows a teaching progression, a customized version becomes certification-ready SCORM coursework with comparatively little restructuring. For programs with more specific needs, the RxSlides team can also narrow the template's scope, adjust branding, or design a fully custom nephrology presentation from scratch.
Medical & Healthcare Education
Nephrology and nursing faculty teaching renal pathophysiology can lean on the template's animated nephron and glomerulus illustrations to explain normal kidney filtration before introducing CKD-specific damage, without redrawing the anatomy each semester. CME providers preparing sessions on renal disease staging benefit from the same GFR-based classification content, instead of rebuilding a staging table for every course. Patient educators adapting the symptom and prevention infographics for community sessions can simplify the same material while keeping the underlying physiology accurate. Students and trainees leave with a structured understanding of how CKD progresses from risk factor to renal replacement therapy.
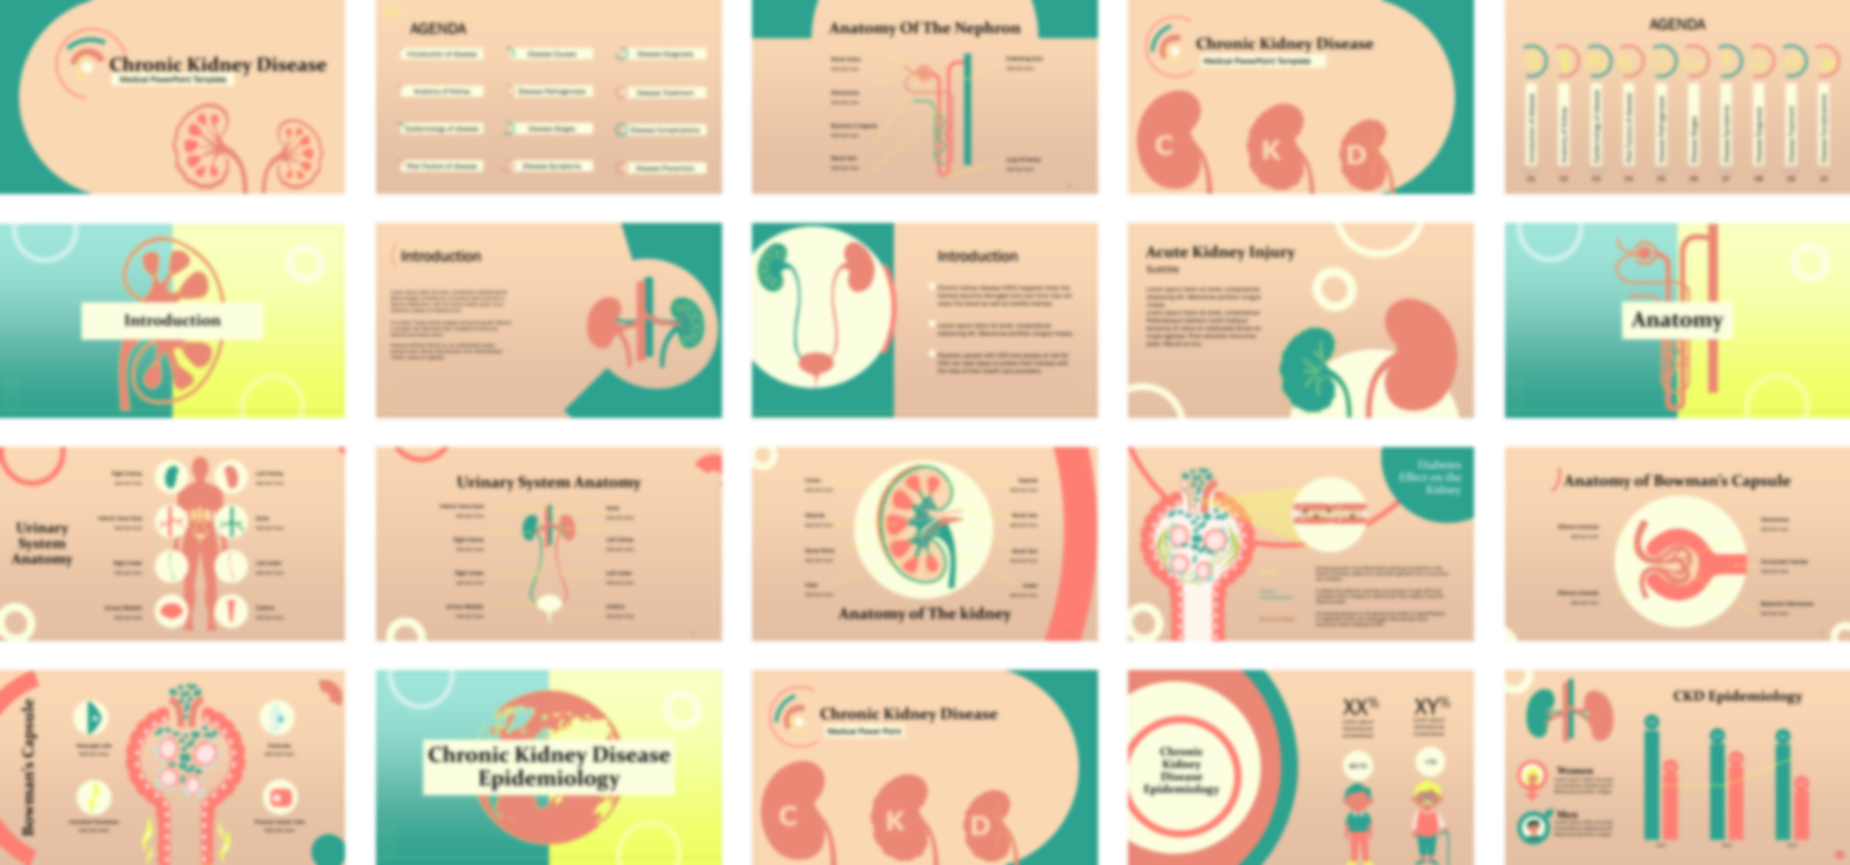
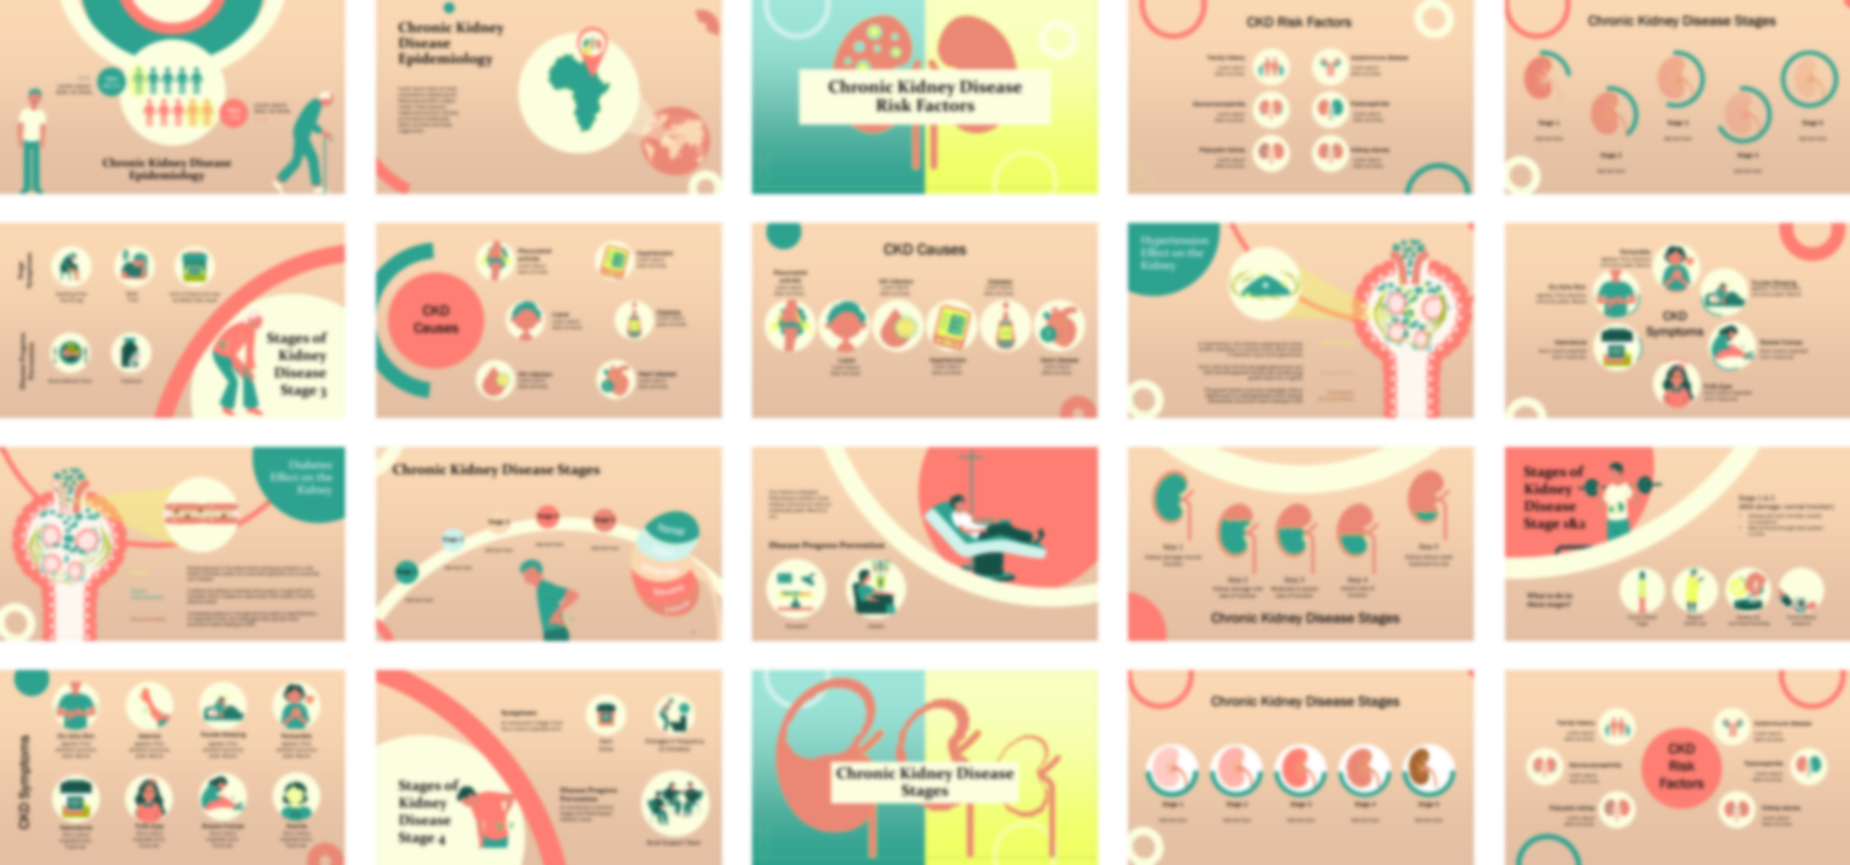
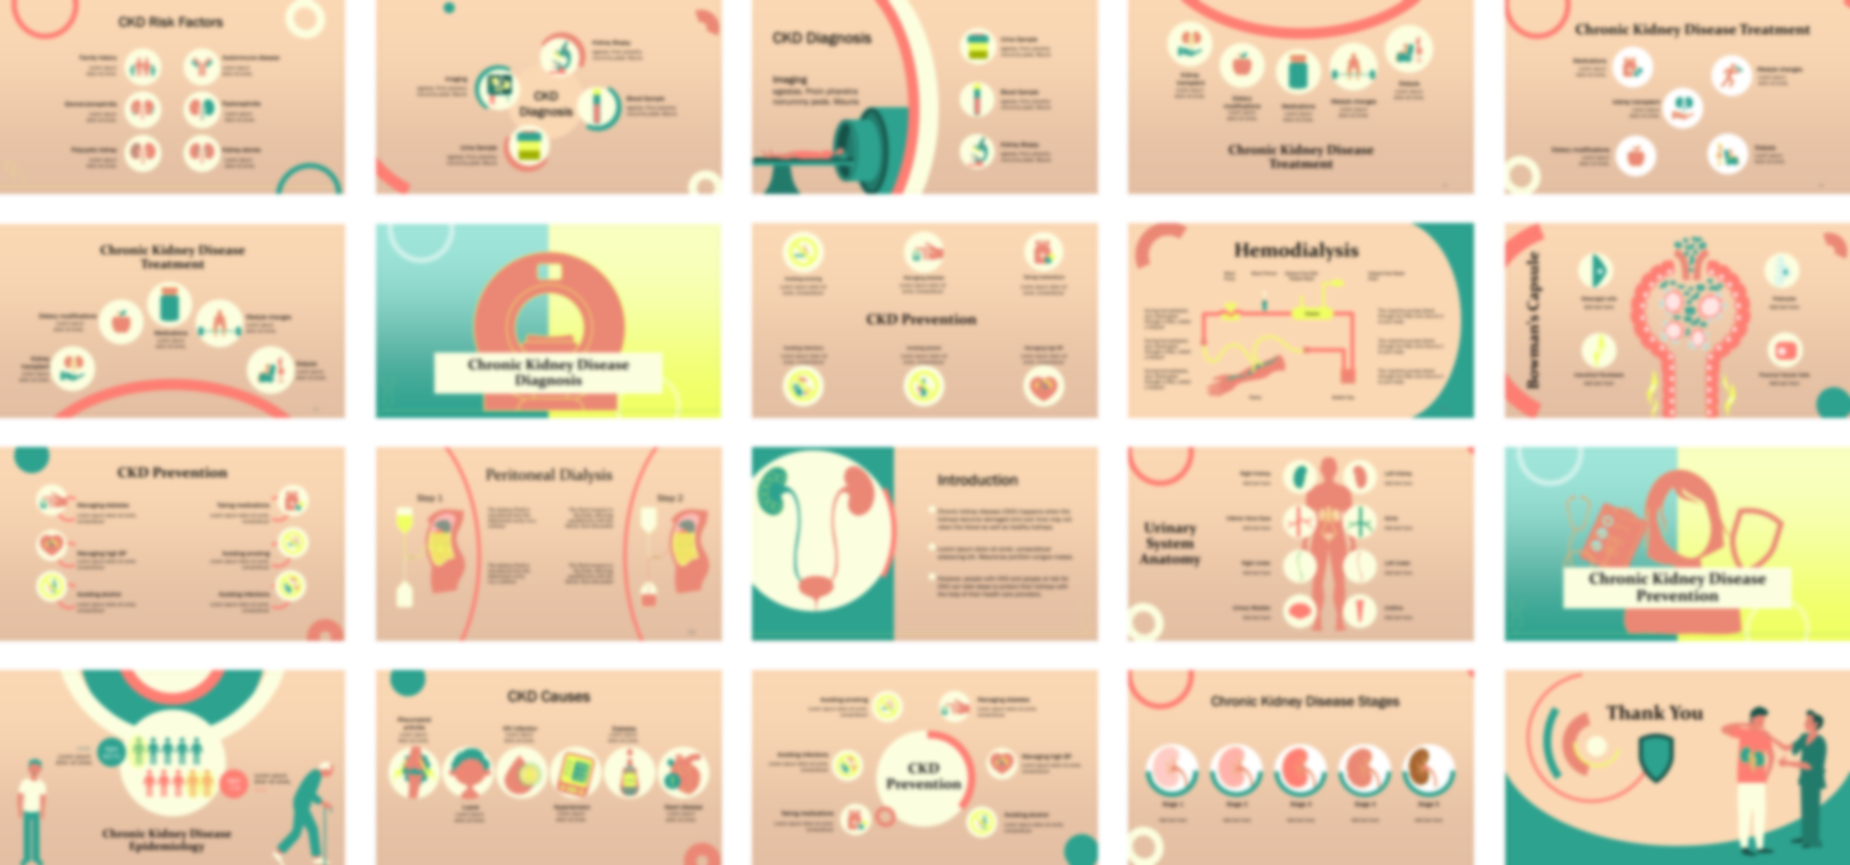
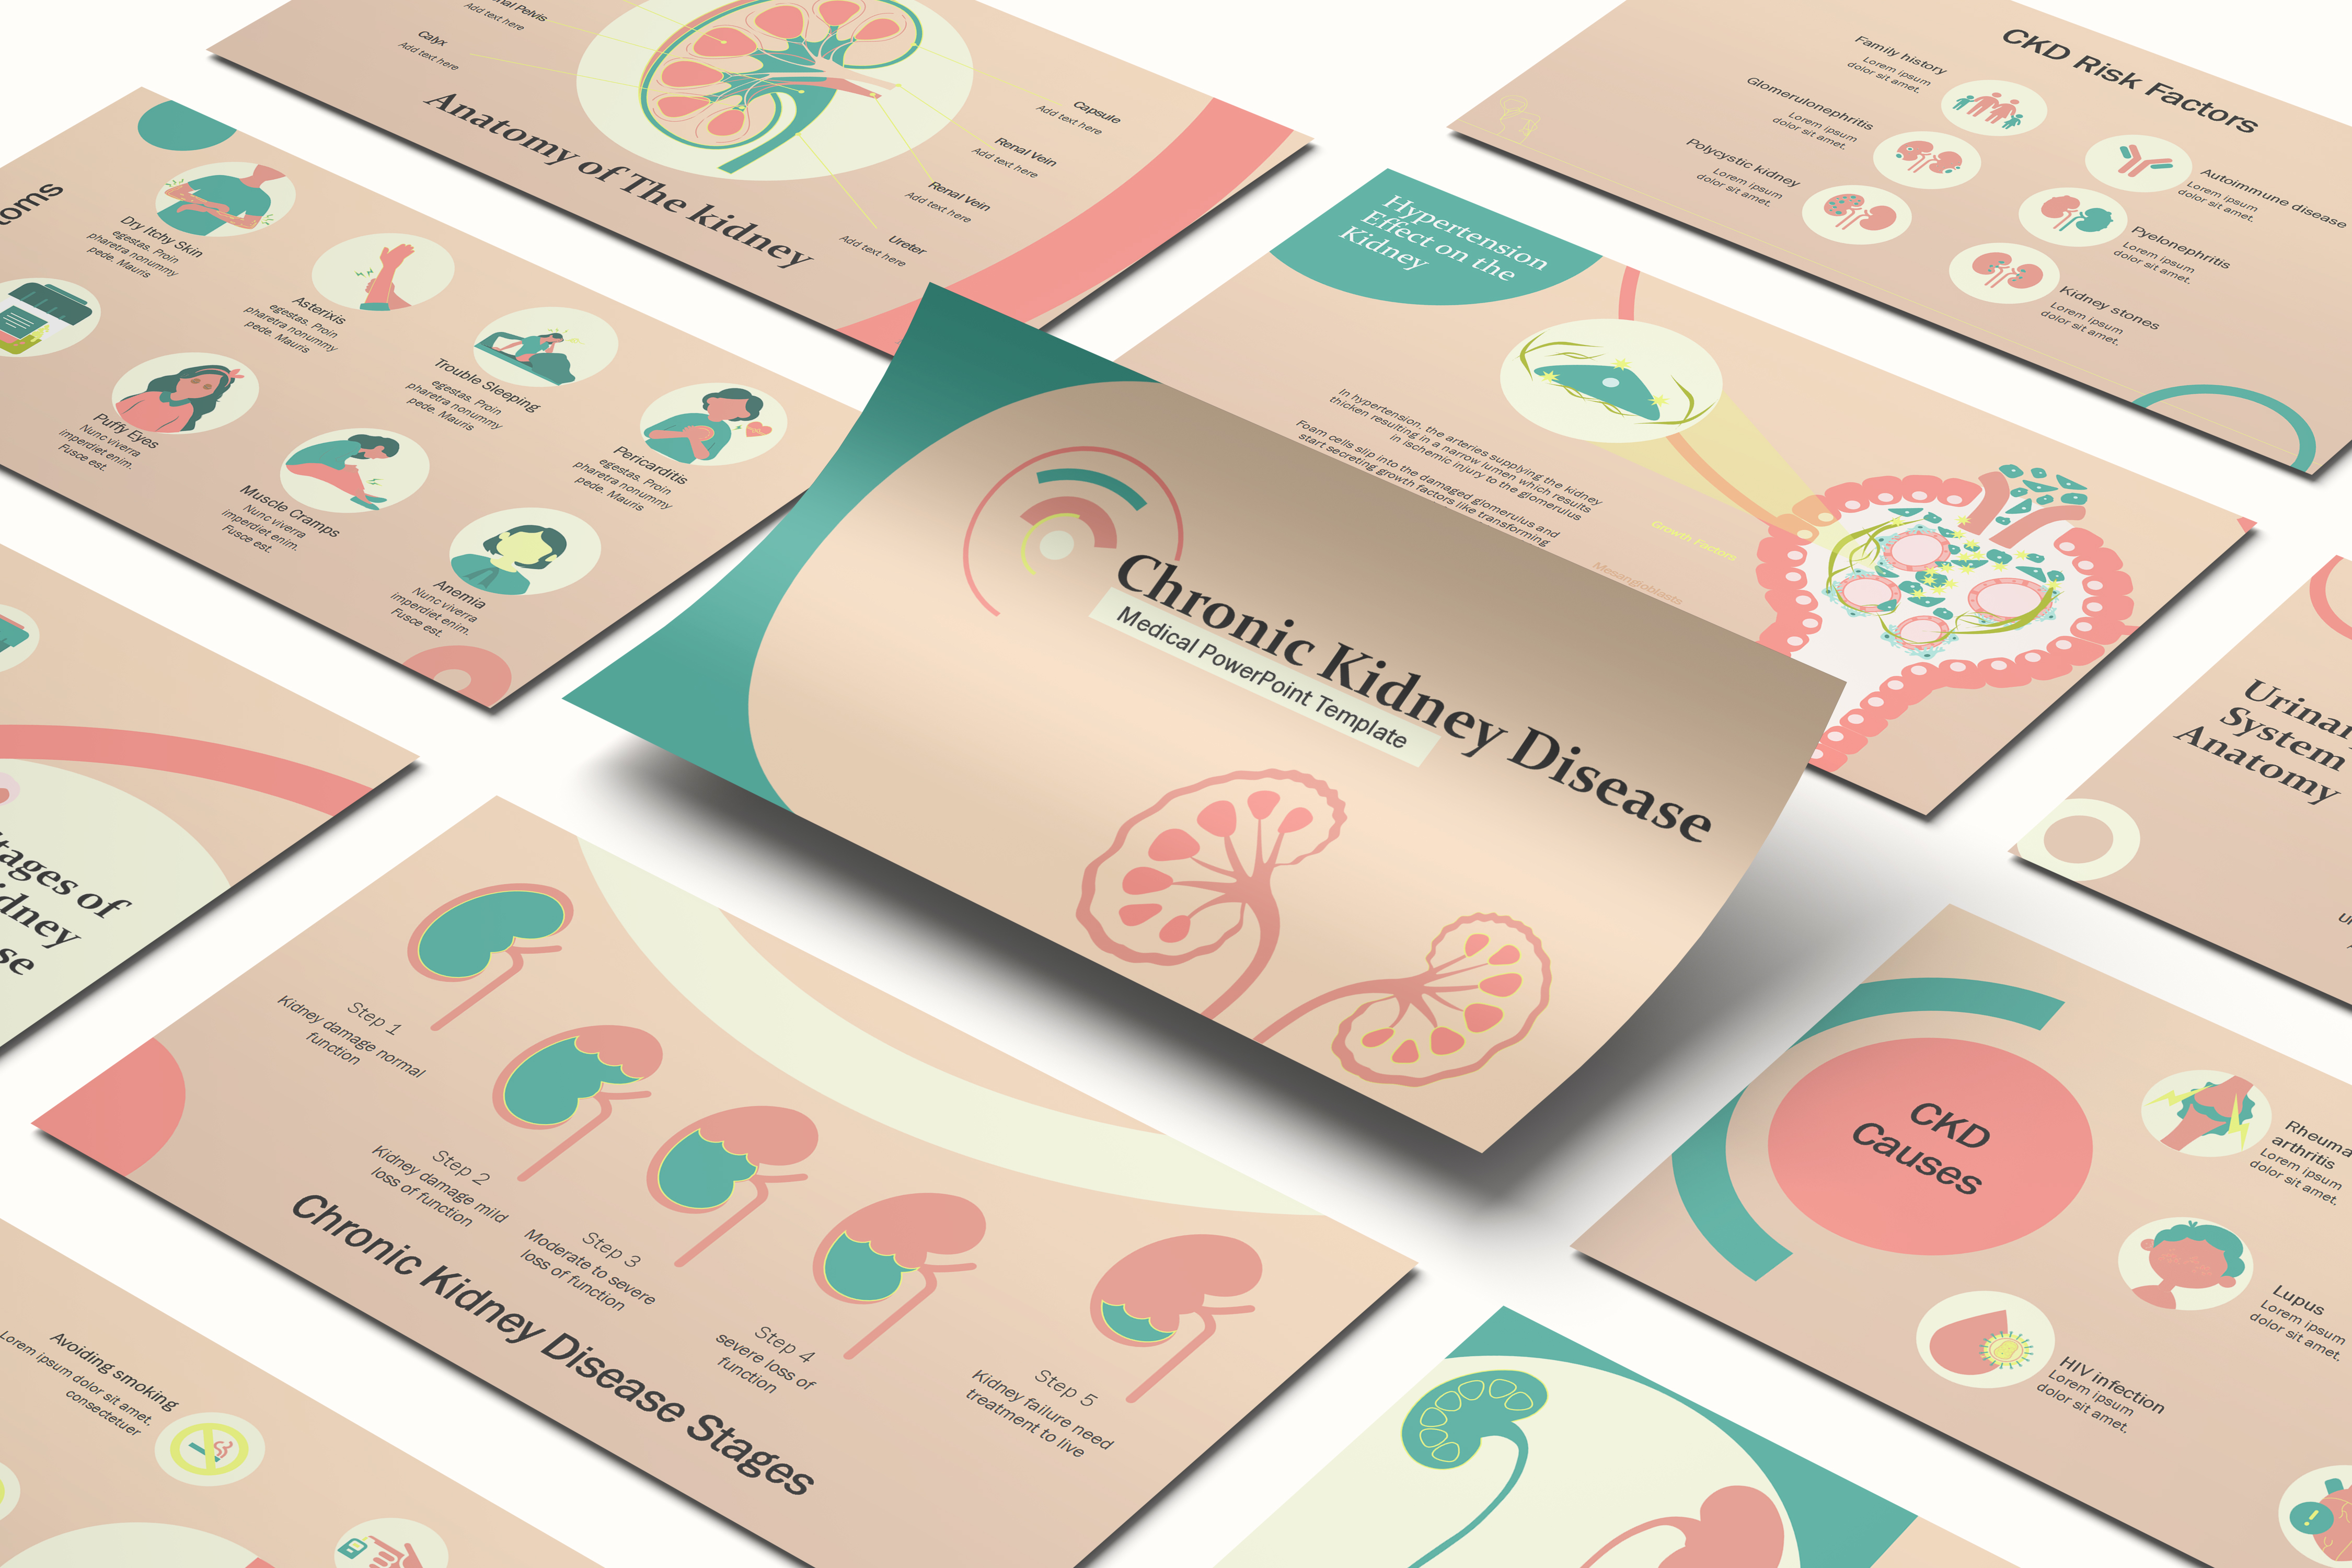
The Chronic Kidney Disease PowerPoint template opens with cover slides and an editable table of contents before a definition slide describes the condition as chronic kidney dysfunction, supported by illustrative depictions. Animated anatomy slides then detail the urinary system down to the nephron, glomerulus, proximal and distal tubules, loop of Henle, and collecting duct, including the afferent and efferent arteries, mesangial cells, and podocytes.
An animated infographic visualizes worldwide and local prevalence with adjustable percentages and countries, before customizable medical icons cover risk factors including familial predisposition, autoimmune disorders, glomerulonephritis, and polycystic kidney disease. Further icons detail causes such as HIV infection, rheumatoid arthritis, hypertension, heart disease, diabetes, and lupus.
Animated slides explain how hypertension thickens and narrows the arteries supplying the kidney while diabetes causes non-enzymatic glycation that stiffens the efferent arteriole, both pathways prompting mesangial cells to secrete the structural matrix that drives disease progression. Establishing this dual mechanism first gives educators a shared reference point before an editable infographic uses colorful kidney icons to stage the progressive decline in kidney function.
Creative icons illustrate symptoms including fatigue, swelling, nausea, itching, and changes in urine flow, before matching icons walk through diagnosis via imaging, blood tests, urine tests, and kidney biopsy. The presentation template closes with animated treatment slides covering medication, lifestyle changes, hemodialysis, and peritoneal dialysis, editable icons for prevention, and a final set covering complications such as bone disease, anemia, and cardiovascular disease.
Ready To Transform Your Presentation ?
Pay once, use forever