Osteoporosis PowerPoint Template
No items found.
Osteoporosis Presentation: Medical PowerPoint Template
- The Osteoporosis PPT template is a PowerPoint presentation that will help your audience understand your presentation's full potential.
- RxSlides template includes medical animations and infographics, which will attract your audience.
- You can depend on our demonstrated infographics to give your audience a dynamic and attractive Osteoporosis presentation.
- Upgrade your Musculoskeletal PowerPoint presentation with our comprehensive templates library and Simplify Complex Musculoskeletal Concepts with impressive Visuals.
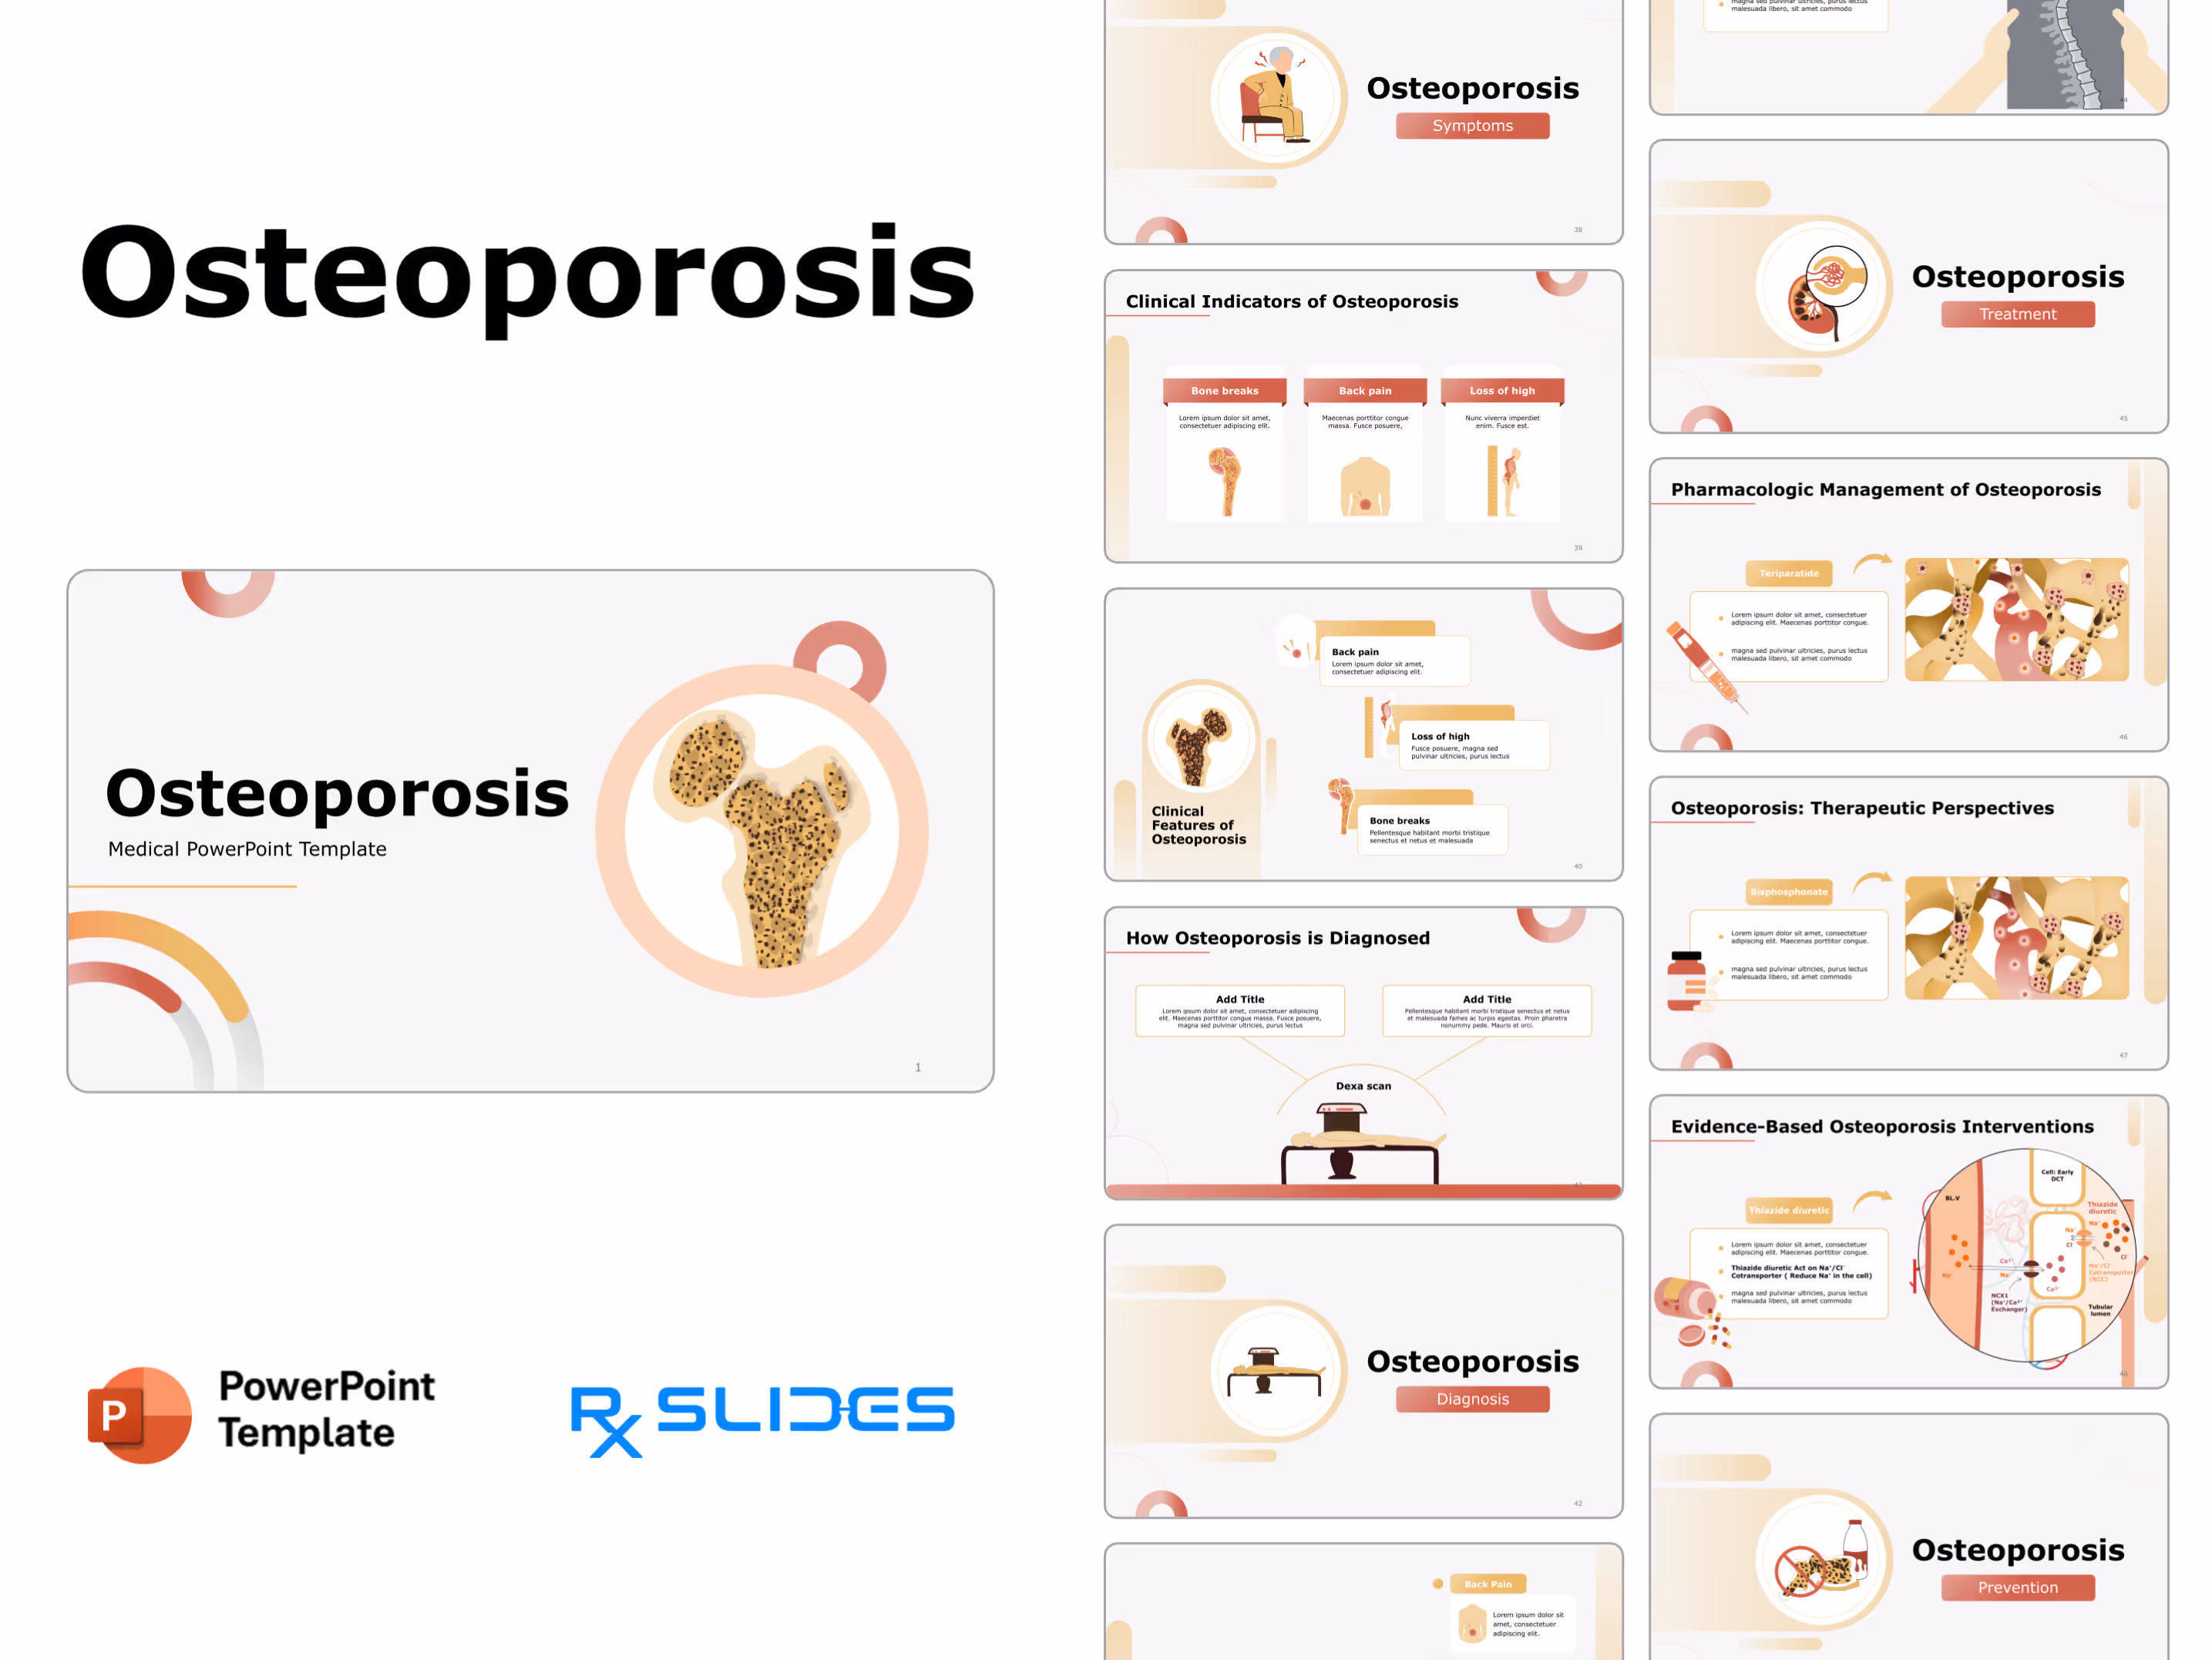
Osteoporosis PowerPoint Template Preview
Osteoporosis PowerPoint Template Content
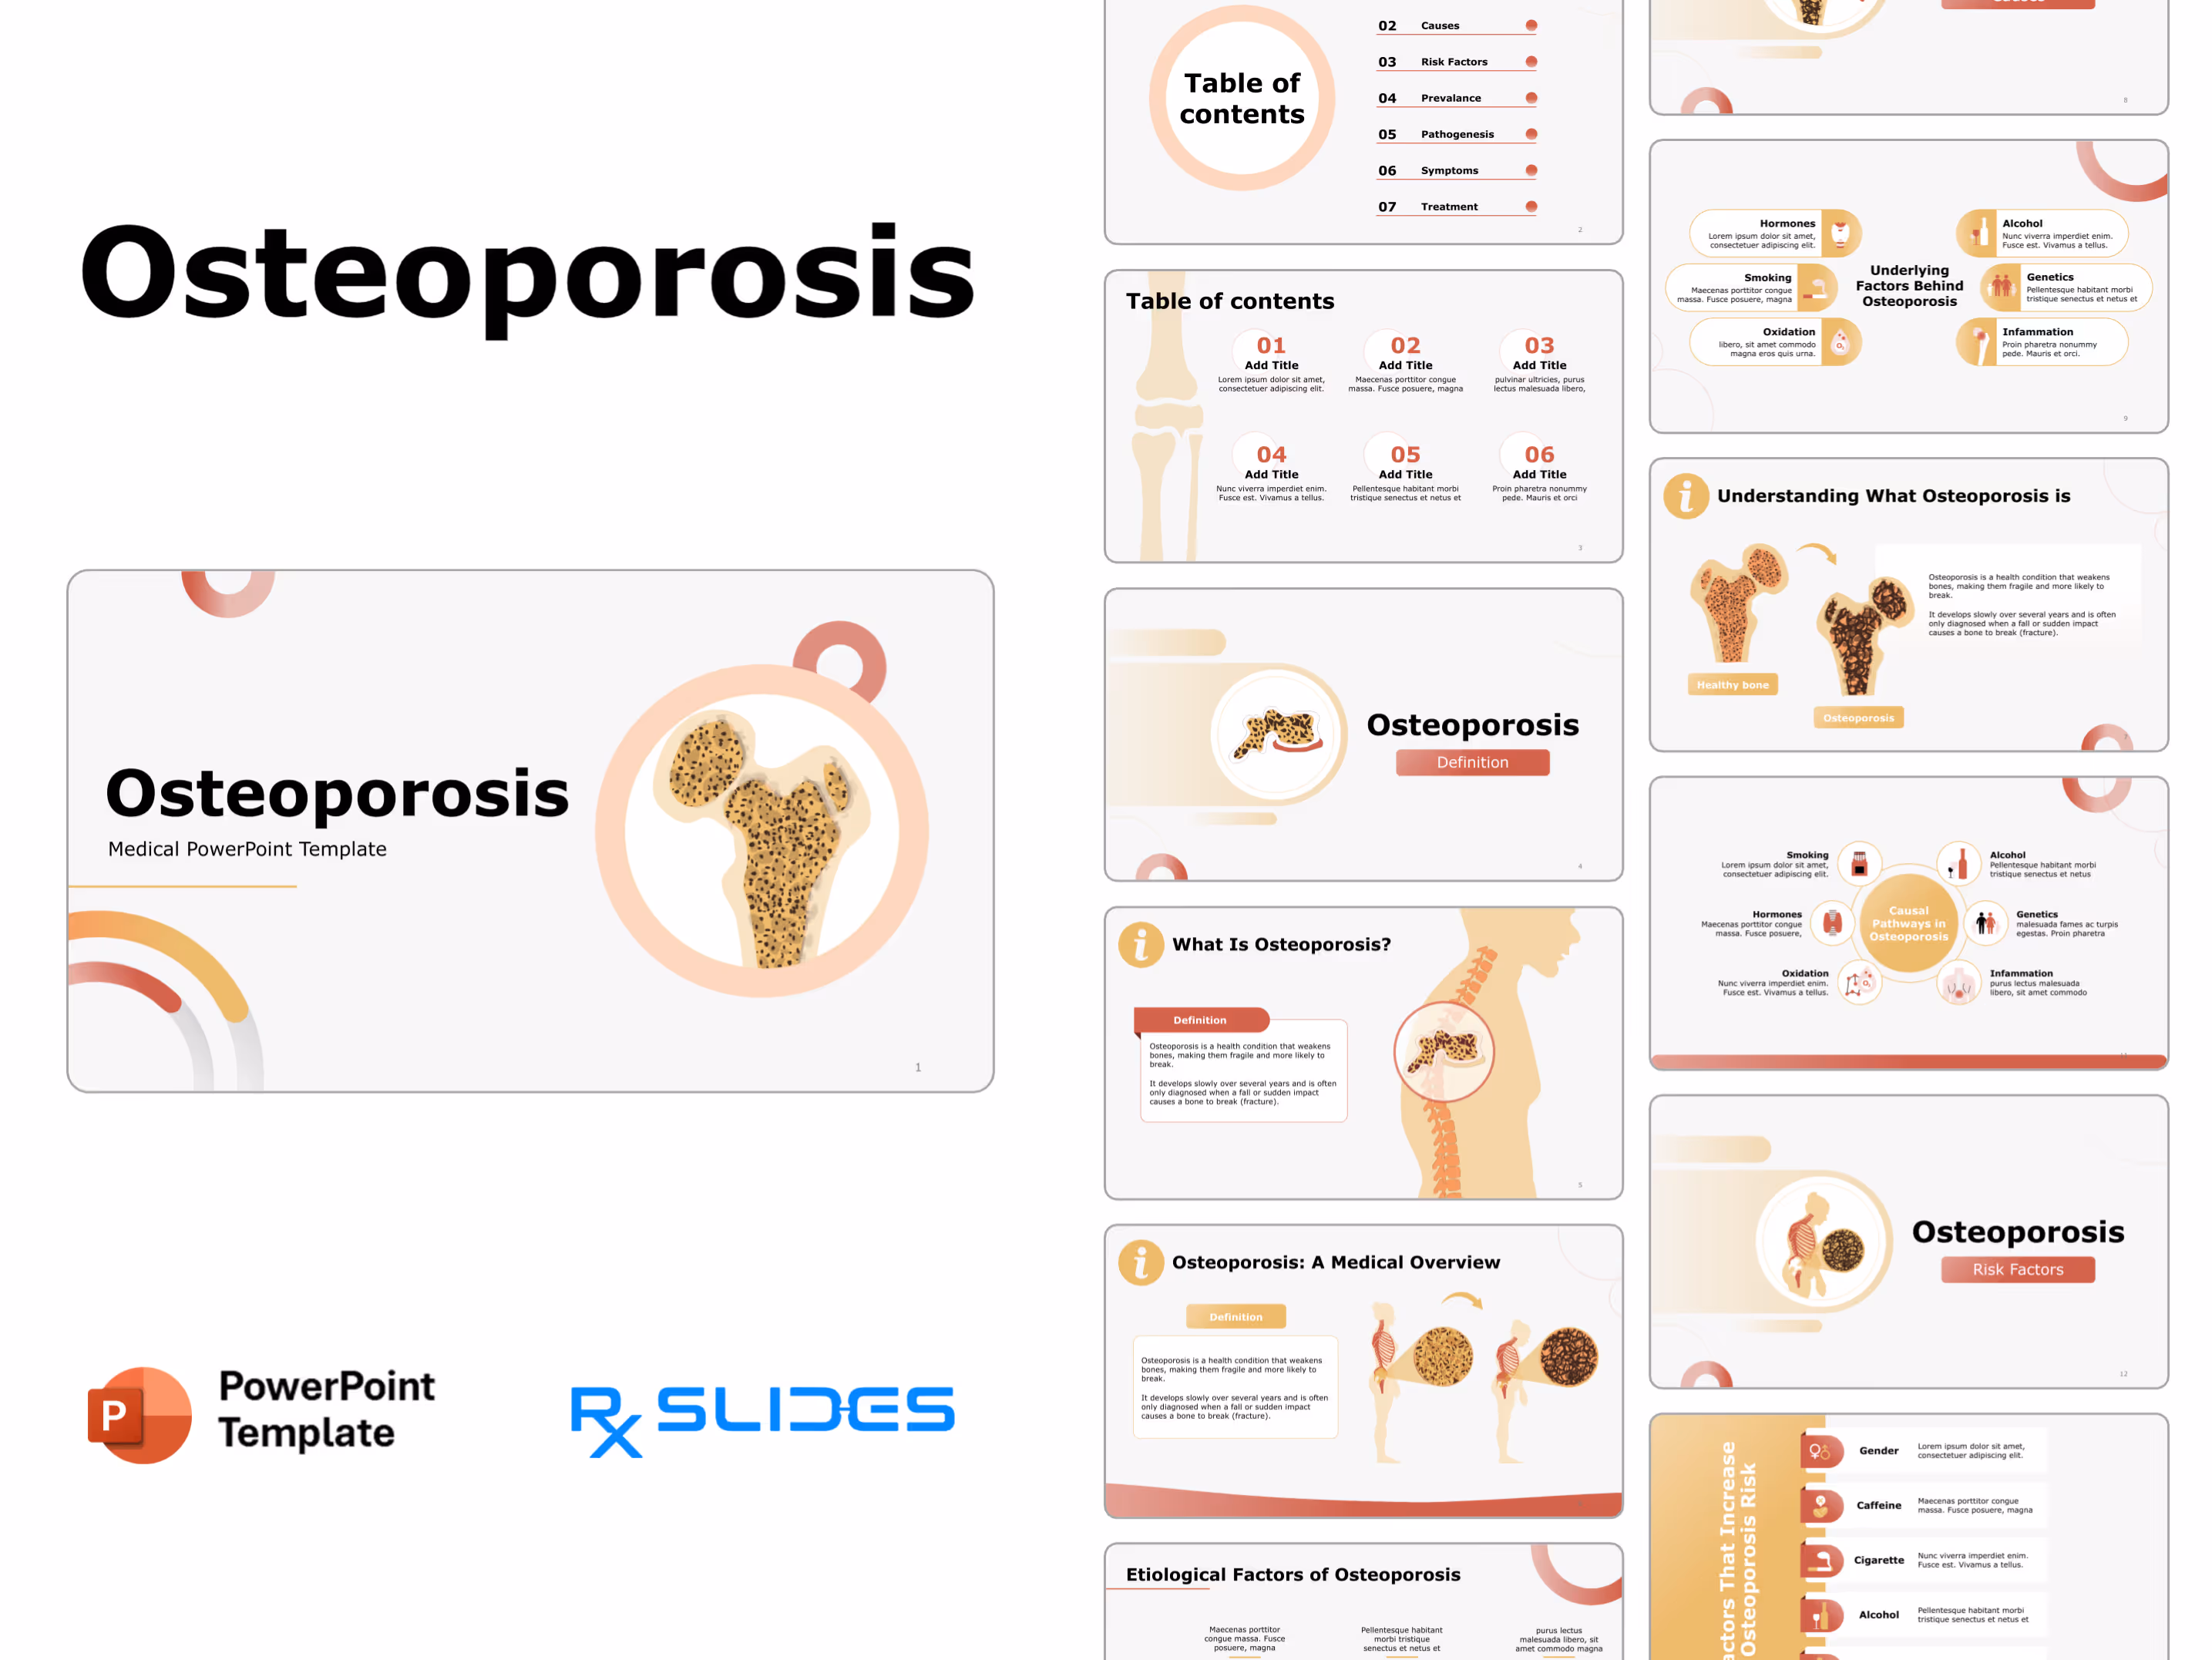
Slide 1 - Osteoporosis Introduction (Title Slide)
.avif)
- Introduces the presentation on Osteoporosis with a professional and clean design aesthetic.
- The slide clearly features a large, central illustration of a bone cross-section, visually communicating the topic's focus on bone health and structure.
Slide 2 - Table of Contents (Navigation)
.avif)
- Outlines the presentation, guiding your audience through seven essential topics, from Definition to Treatment.
- The clean, numbered list structure (01 to 07) makes organizing your lecture simple and professional.
Slide 3 - Table of Contents (Visual Index)
.avif)
- introduces six specific concepts, using placeholder titles and text that you can easily customize for depth and detail.
- The slide features a prominent, stylized femur bone running down the left side.
Slide 4 - Definition Section (Content Header)
.avif)
- transition into the definition segment of the Osteoporosis presentation.
- The slide features a prominent graphic of a damaged vertebral cross-section, which instantly reinforces the medical concept you are about to define.
Slide 5 - Osteoporosis Definition (Detail)
.avif)
- defines Osteoporosis as a condition that weakens bones, making them fragile and likely to fracture.
- The design features a compelling visual of the human spine and a zoomed-in cross-section of a damaged vertebra.
Slide 6 - Osteoporosis Definition (Detailed Visual)
.avif)
- defines Osteoporosis as a condition that weakens bones, making them fragile and more likely to fracture.
- The design features a large, detailed graphic of the full spinal column alongside a magnified cross-section of a damaged vertebra.
Slide 7 - Healthy vs. Osteoporosis (Comparison)
.avif)
- shows the clear visual difference between a healthy bone and one affected by Osteoporosis.
- The slide features two large, labeled cross-sections of the femur, highlighting the porous and weakened structure of the osteoporotic bone versus the dense, healthy one.
Slide 8 - Causes Section (Content Header)
.avif)
- transition into the discussion about the Causes of Osteoporosis.
- The slide features a compelling visual of a magnified bone cross-section with a DNA strand, which instantly suggests the topic's focus on genetic and biological origins.
Slide 9 - Underlying Factors (Causes Detail)
.avif)
- Details the six key underlying factors that contribute to Osteoporosis, from Genetics to Lifestyle elements like Smoking and Alcohol.
- The layout uses six distinct, creatively designed icons to represent each cause (e.g., hormones, genetics, smoking).
Slide 10 - Etiological Factors (Sequence)
.avif)
- presents six key risk factors contributing to Osteoporosis in a smooth, chronological or sequential manner.
- The design employs a horizontal flow with distinct circular icons and placeholders for content.
Slide 11 - Causal Pathways (In-Depth Factors)
.avif)
- details the six core causal pathways of Osteoporosis, including Genetics, Hormones, and lifestyle factors like Smoking and Alcohol.
- The slide features a visually engaging, radial design where key factors surround a central theme.
Slide 12 - Risk Factors Section (Content Header)
.avif)
- transit into the crucial discussion about the Risk Factors associated with Osteoporosis.
- The slide features a prominent graphic of a full skeleton with an exaggerated, magnified view of fragmented bone.
Slide 13 - Risk Factors (Key List)
.avif)
- presents five critical risk factors for Osteoporosis, including Gender, Lifestyle choices, and Age, using clear icons for instant visual recognition.
- The layout uses a clean, vertical structure with large, labeled tab sections.
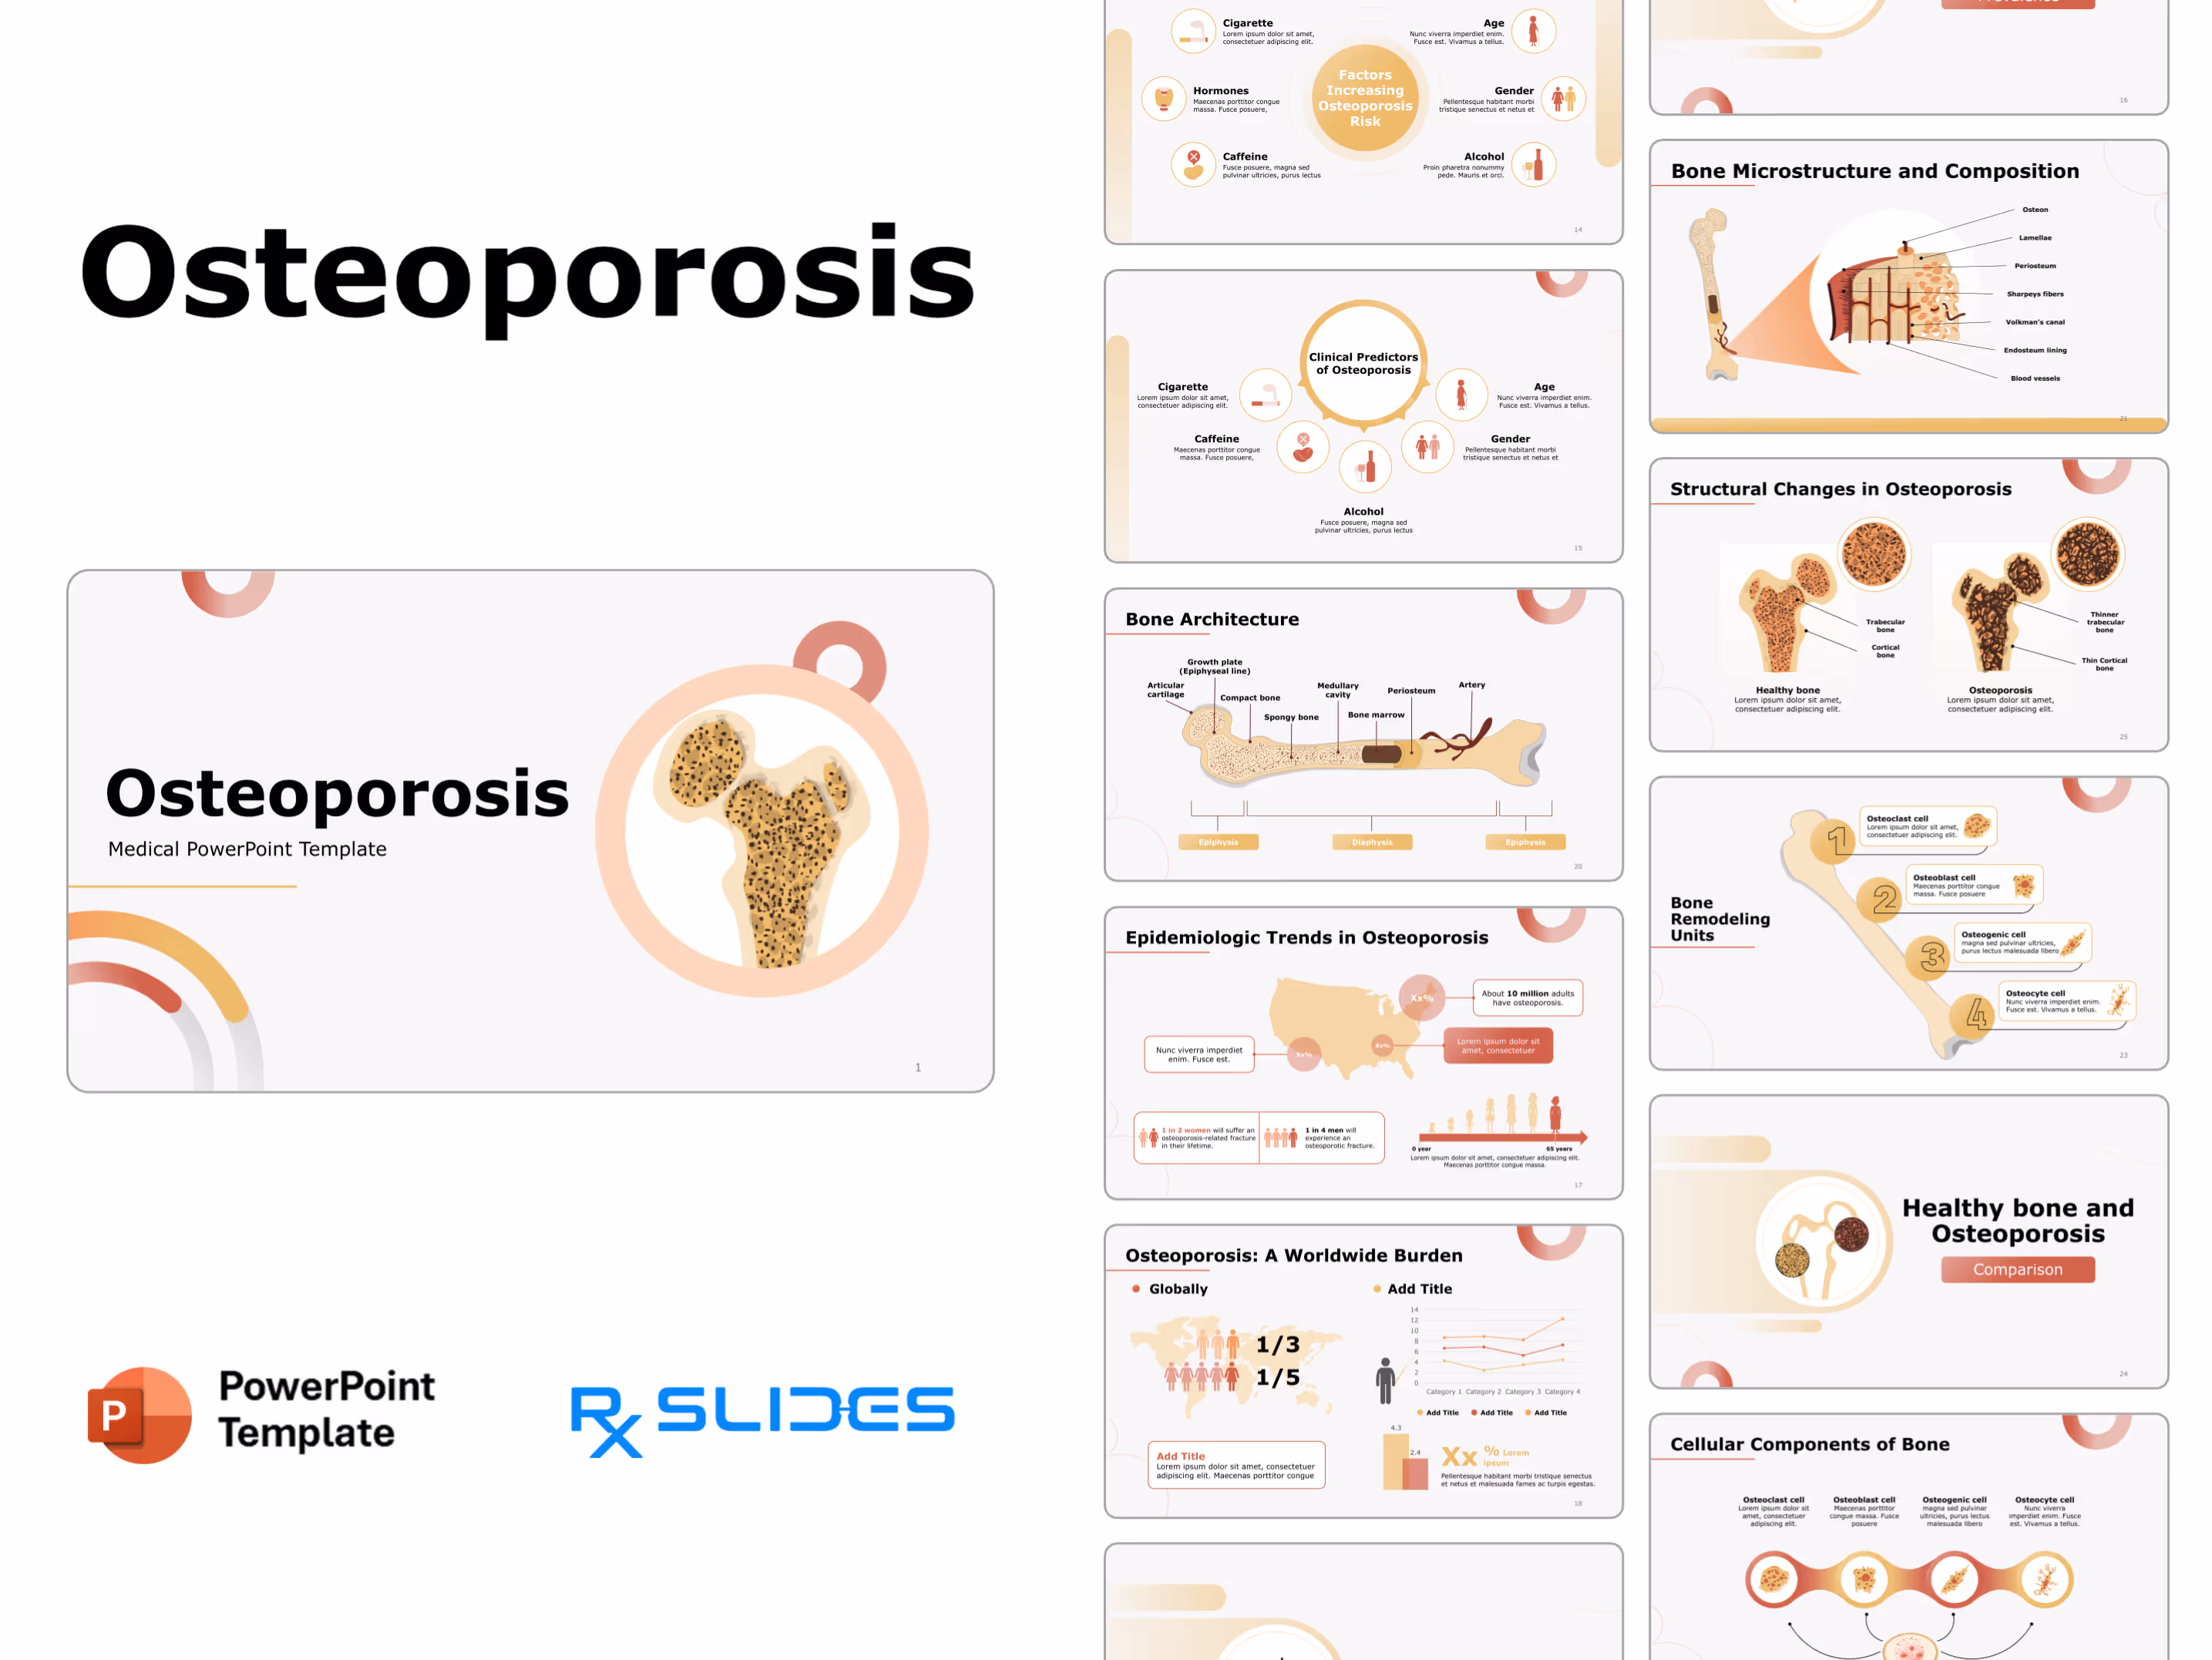
Slide 14 - Increasing Risk Factors (Detailed List)
.avif)
- details seven key factors that increase Osteoporosis risk, including Hormones, Lifestyle choices, Age, and Caffeine consumption.
- The design uses a radial structure where key risk elements surround a central hub.
Slide 15 - Clinical Predictors (Risk Factors Summary)
.avif)
- You can use this central graphic layout to effectively summarize the five key clinical predictors of Osteoporosis, including Age, Gender, and lifestyle elements like Caffeine and Alcohol.
- The design employs a compelling radial structure where these predictors surround a central title.
Slide 16 - Prevalence Section (Content Header)
.avif)
- clearly transition into the important discussion about the Prevalence and global scope of Osteoporosis.
- The slide features a dynamic graphic of a world map with a bone location pin.
Slide 17 - Epidemiologic Trends (Statistics)
.avif)
- presents the epidemiologic trends of Osteoporosis, including statistics on prevalence in women (1 in 2) and men (1 in 4).
- The layout features compelling demographic data, a map of the United States with visual percentage breakdowns, and an age timeline to illustrate the disease's extensive reach.
Slide 18 - Global Burden (Worldwide Statistics)
.avif)
- communicates the global prevalence of Osteoporosis, prominently featuring the statistics that 1 in 3 women and 1 in 5 men are affected.
- The design integrates a world map graphic with various charts and data visualizations (line graphs and bar charts).
Slide 19 - Bone Anatomy Section (Content Header)
.avif)
- transition into the fundamental discussion about Bone Anatomy relevant to Osteoporosis.
- The slide features a detailed, central illustration of a bone cross-section.
Slide 20 - Bone Architecture (Anatomy Detail)
.avif)
- clearly illustrates the structure of a long bone, labeling crucial components like Compact bone, Spongy bone, and Bone marrow.
- The slide features a large, horizontally oriented diagram of the bone architecture.
Slide 21 - Bone Microstructure (Detailed Anatomy)
.avif)
- illustrates the microstructure of bone, labeling crucial elements like the Osteon, Lamellae, Periosteum, and blood vessels.
- The slide features an enlarged, exploded view of the bone cross-section, providing essential visual context for understanding the cellular components affected by Osteoporosis.
Slide 22 - Cellular Components (Biology Detail)
.avif)
- illustrates the four main cell types responsible for bone health: Osteoclast, Osteoblast, Osteogenic cell, and Osteocyte.
- The slide features a visually clear, horizontal flow of these distinct cellular components.
Slide 23 - Bone Remodeling Units (Key Cells)
.avif)
- illustrates the four primary cells vital for bone health, including Osteoclasts, Osteoblasts, and Osteocytes, presented along a femur graphic.
- The design uses a unique numbered sequence (1 through 4).
Slide 24 - Healthy vs. Osteoporosis (Comparison Header)
.avif)
- transition into a crucial comparison between Healthy bone and Osteoporosis.
- The slide features a prominent graphic of a femur with two circular magnified views.
Slide 25 - Structural Changes (Healthy vs. Osteoporosis)
.avif)
- the structural differences between a healthy bone and one severely affected by Osteoporosis.
- The design features two adjacent femur cross-sections, clearly labeling the reduction of the Trabecular and Cortical bone thickness in the disease state for a powerful visual impact.
Slide 26 - Bone Health Comparison (Micro View)
.avif)
- shows the stark difference between the dense, patterned structure of a Healthy Bone and the porous, degraded tissue of a bone with Osteoporosis.
- The design uses two large, adjacent cross-section graphics separated by a prominent "Vs.".
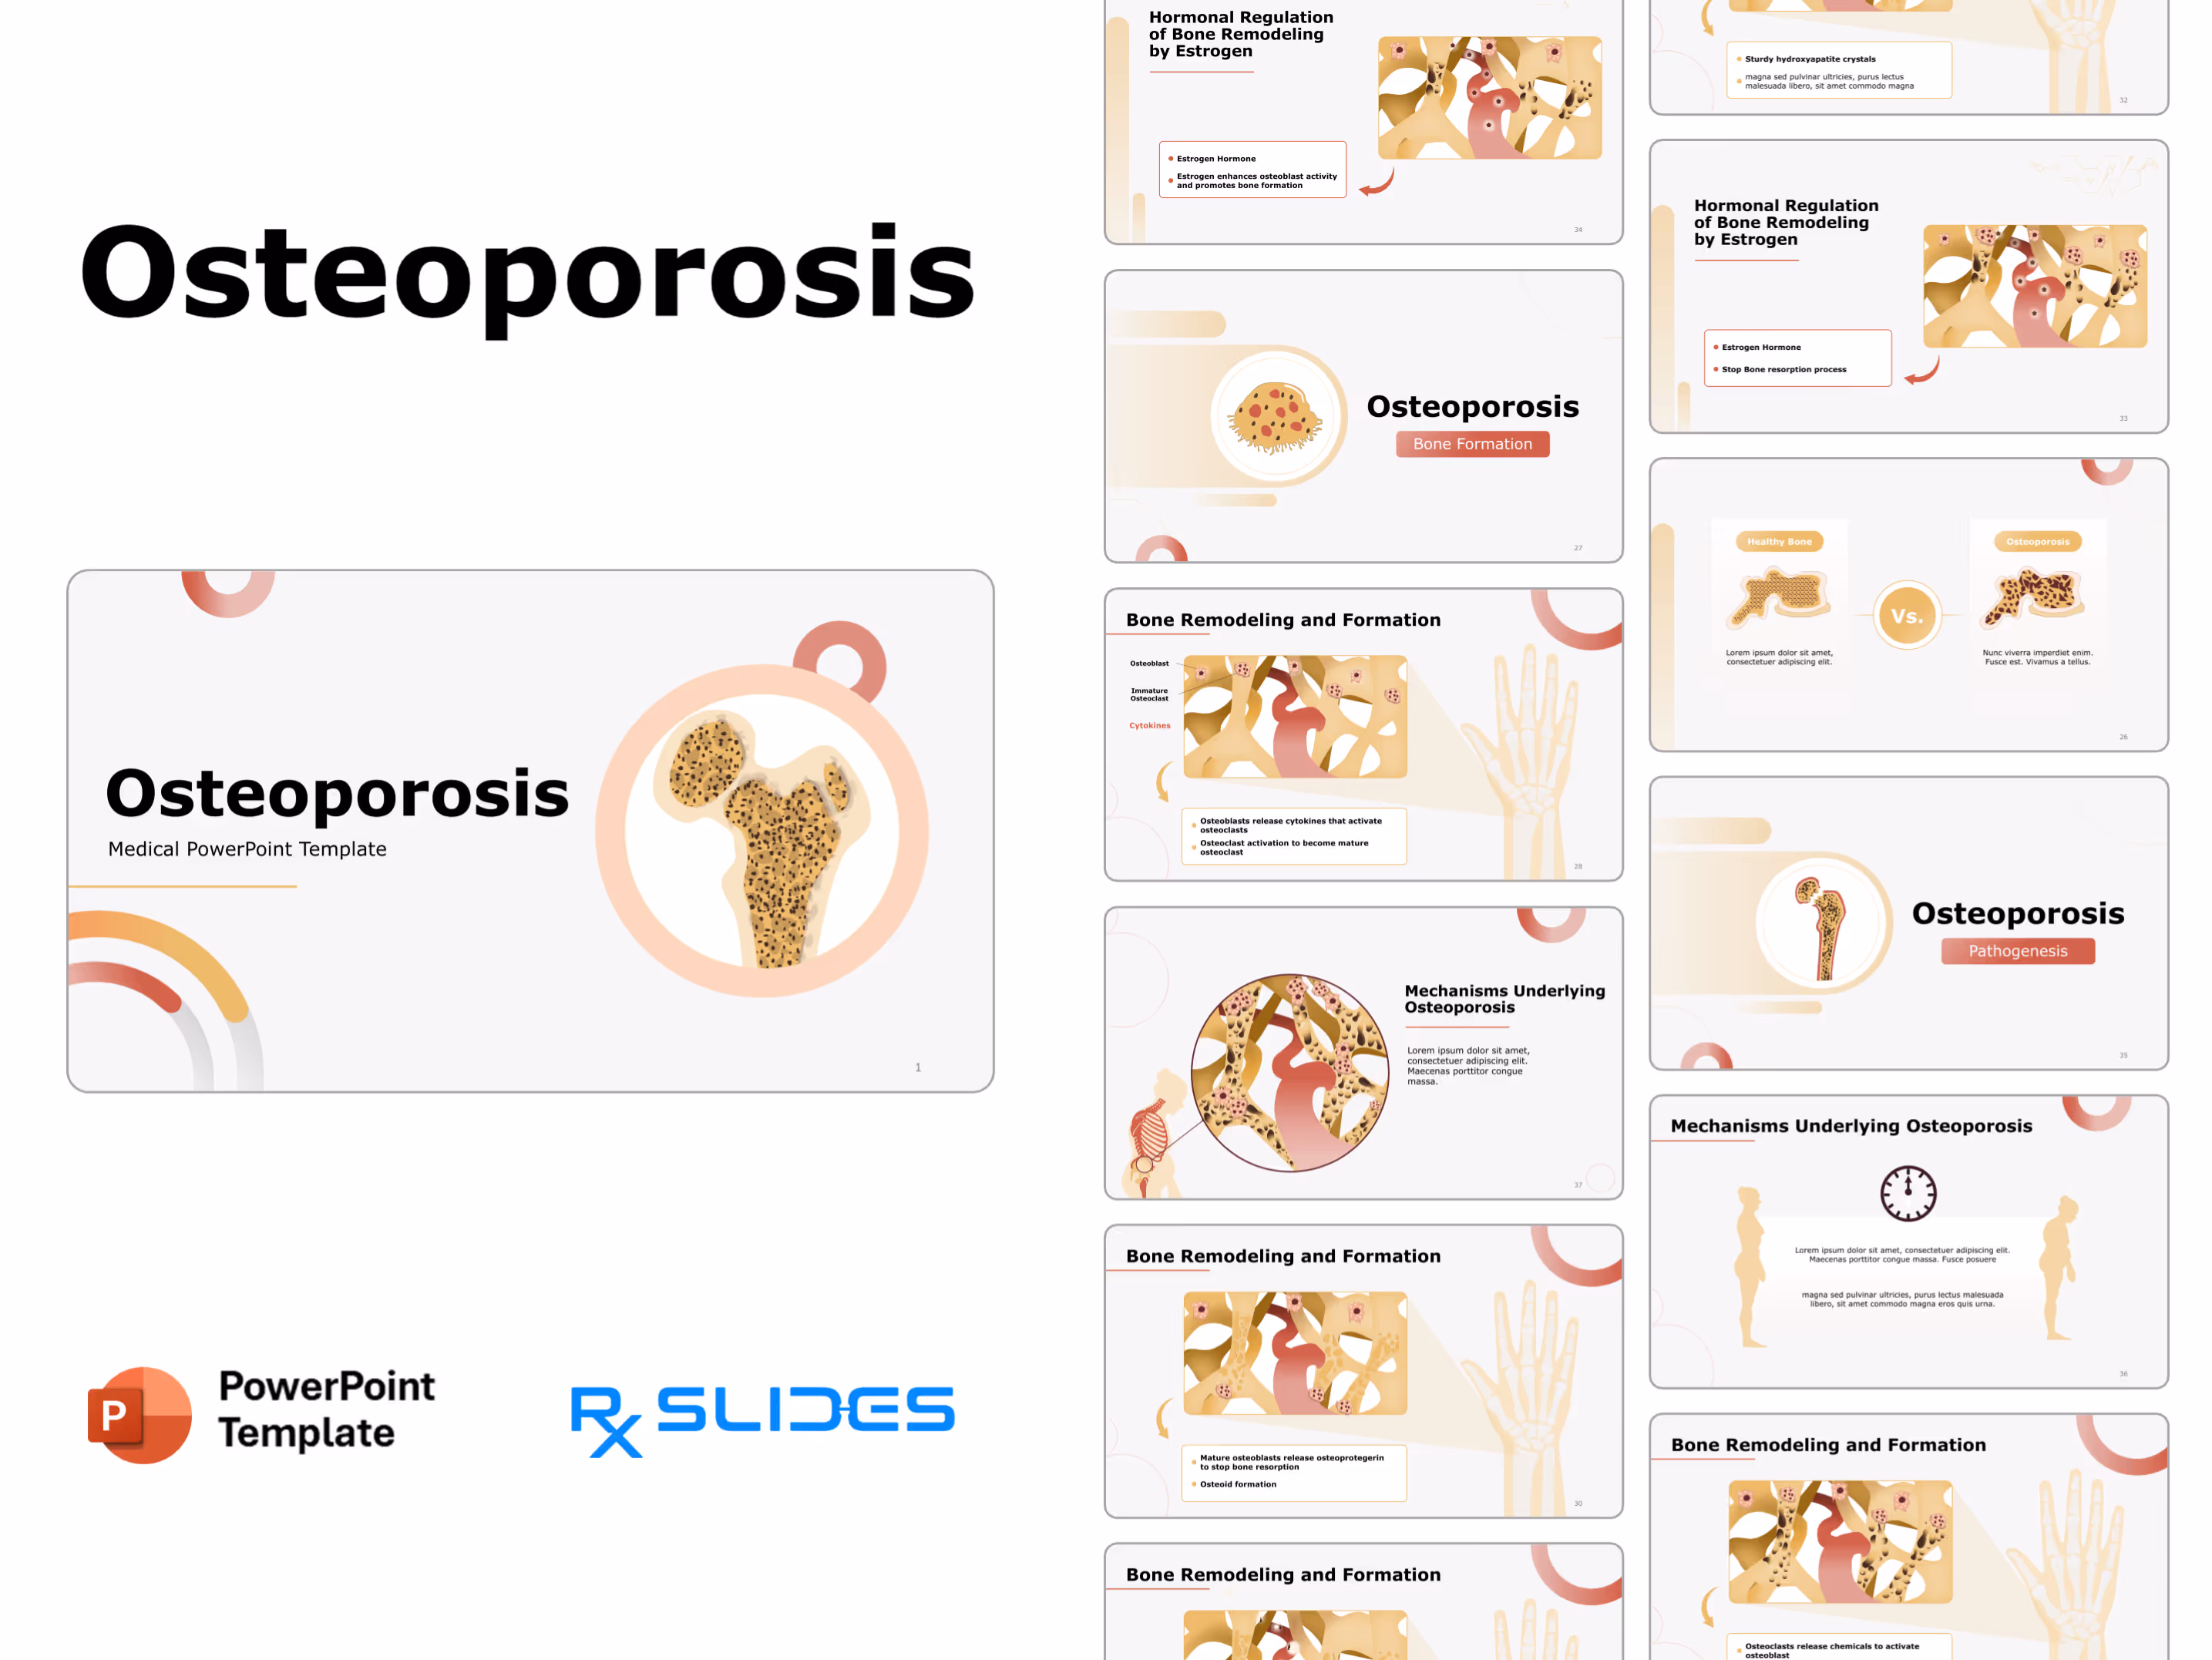
Slide 27 - Bone Formation Section (Content Header)
.avif)
- transition into the fundamental discussion about the healthy process of Bone Formation.
- The slide features a prominent, circular illustration of an Osteoblast (a bone-forming cell), instantly focusing attention on the microscopic foundation of bone health.
Slide 28 - Bone Remodeling (Formation Cycle)
.avif)
- illustrates the initial stages of the bone remodeling process, highlighting how Osteoblasts release cytokines to activate Immature Osteoclasts.
- The slide features a highly detailed, magnified illustration of the bone matrix, showing the communication between cells (Osteoblasts, Immature Osteoclasts, Cytokines) and the blood supply.
Slide 29 - Bone Remodeling (Activation Stage)
.avif)
- illustrates the initial stages of the bone remodeling process, highlighting how Osteoblasts release cytokines to activate Osteoclasts.
- The slide features a highly detailed, magnified illustration of the bone matrix, showing the communication between cells and blood supply, with a focus on the activation and maturation of the osteoclast cells.
Slide 30 - Bone Remodeling (Formation Completion)
.avif)
- concludes the bone remodeling process, highlighting the final steps where Osteoblasts stop bone resorption and proceed with Osteoid formation.
- The slide features a highly detailed, magnified illustration of the bone matrix, focusing on the activity of mature Osteoblasts and the substances they release.
Slide 31 - Bone Remodeling (Mineralization)
.avif)
- illustrates the final, essential step of bone formation where the Osteoid is mineralized using Calcium and Phosphorus.
- The slide features a highly detailed, magnified illustration of the bone matrix.
Slide 32 - Bone Remodeling (Crystal Formation)
.avif)
- illustrates the completion of bone formation, where the calcium and phosphorus create sturdy hydroxyapatite crystals.
- The slide features a highly detailed, magnified illustration of the bone matrix, showing the newly formed, durable structure that reinforces the bone tissue.
Slide 33 - Hormonal Regulation (Estrogen)
.avif)
- illustrates how the Estrogen Hormone influences bone health and works to stop the process of bone resorption.
- The slide features a highly detailed, magnified illustration of the bone matrix, showing the action of the hormone alongside the chemical structure of estrogen for clear context.
Slide 34 - Hormonal Regulation (Estrogen's Role)
.avif)
- effectively illustrates the positive influence of Estrogen, detailing how it enhances osteoblast activity and actively promotes bone formation.
- The slide features a highly detailed, magnified illustration of the bone matrix, showing the hormone's action to build and strengthen bone tissue.
Slide 35 - Pathogenesis Section (Content Header)
.avif)
- clearly transition into the scientific discussion about the Pathogenesis (development) of Osteoporosis.
- The slide features a prominent graphic of a damaged femur cross-section.
Slide 36 - Mechanisms (Visual Impact)
.avif)
- visually represents the Mechanisms Underlying Osteoporosis by contrasting a healthy figure with one exhibiting characteristic changes over time.
- The design features a clock icon between the two figures, clearly suggesting the slow, progressive nature of the disease and its impact on posture and body shape.
Slide 37 - Pathogenesis (Cellular Mechanism)
.avif)
- illustrates the microscopic mechanism of Osteoporosis, showing the imbalance between bone formation and breakdown cells.
- The design features a dramatic, circular, magnified view of the bone matrix and active cells, connecting the cellular damage to a small illustration of a fractured spine and hip.
Slide 38 - Symptoms Section (Content Header)
.avif)
- clearly transition into the crucial discussion about the Symptoms and pain associated with Osteoporosis.
- The slide features a prominent graphic of an elderly figure sitting and experiencing back pain.
Slide 39 - Clinical Indicators (Observable Signs)
.avif)
- Details the three main clinical indicators of Osteoporosis: Bone breaks (fractures), Back pain, and Loss of height.
- The slide features three distinct vertical panels with compelling visuals, including a fractured bone graphic, a pain graphic, and a measuring chart.
Slide 40 - Clinical Features (Three-Part Summary)
.avif)
- reinforce the three main clinical features of Osteoporosis: Bone breaks, Back pain, and Loss of height.
- The slide features three distinct, visually separated panels, each with an icon (fractured bone, spine, and measuring stick).
Slide 41 - Clinical Manifestations (Visual Summary)
.avif)
- to reinforce the three main physical manifestations of Osteoporosis: Bone breaks, Back pain, and Loss of height.
- The slide features a central title surrounded by three distinct callout boxes with icons.
Slide 42 - Diagnosis Section (Content Header)
.avif)
- transition into the crucial discussion about the Diagnosis methods for Osteoporosis.
- The slide features a prominent graphic of a person undergoing a bone density scan (DEXA), which instantly visualizes the primary diagnostic technique.
Slide 43 - Diagnosis Detail (DEXA Scan)
.avif)
- illustrates the primary method for detecting Osteoporosis: the DEXA scan (Dual-Energy X-ray Absorptiometry).
- The central graphic shows a patient undergoing the scan.
Slide 44 - Diagnosis Detail (C.T. Scan)
.avif)
- illustrates the use of a C.T. Scan (Computed Tomography) in the assessment of Osteoporosis.
- The central graphic features a pair of hands holding an X-ray image of the spinal column.
Slide 45 - Treatment Section (Content Header)
.avif)
- transition into the crucial discussion about the Treatment and management strategies for Osteoporosis.
- The slide features a prominent graphic of a kidney and its associated blood vessels (representing renal regulation).
Slide 46 - Pharmacologic Management (Teriparatide)
.avif)
- illustrates the use of Teriparatide in the pharmacologic management of Osteoporosis.
- The design features a compelling graphic of an injectable syringe alongside a magnified view of the bone matrix.
Slide 47 - Pharmacologic Management (Bisphosphonate)
.avif)
- illustrates the mechanism of action of Bisphosphonates, a primary drug class for managing Osteoporosis.
- The design features a compelling graphic showing the drug binding to the bone matrix, stopping the activity of bone-resorbing cells (Osteoclasts), alongside a bottle of pills.
Slide 48 - Evidence-Based Intervention (Thiazide Diuretic)
.avif)
- effectively illustrates the mechanism of action of a Thiazide diuretic in reducing Na+ concentration in the cell, which subsequently promotes Ca2+ reabsorption.
- The design features a detailed, magnified illustration of the renal tubule (Early DCT) and the action of the drug on the Na+/Cl- Cotransporter (NCC) and Na+/Ca2+ Exchanger (NCX1).
Slide 49 - Prevention Section (Content Header)
.avif)
- section header to transit into the crucial discussion about the Prevention and lifestyle strategies for maintaining bone health.
- The slide features a prominent graphic of a fractured bone crossed out and a bottle of milk.
Slide 50 - Prevention Strategies (Key Factors)
.avif)
- outlines the six key strategies for maintaining bone health, including Vitamin D, Calcium, Physical activity, and Weight management.
- The design uses a strong visual deterrent (a fractured bone crossed out) at the center, surrounded by icons for each preventative measure (sun, milk bottle, dumbbell, scale).
Slide 51 - Thank You (Closing Slide)
.avif)
- concludes the Osteoporosis presentation and thank your audience.
- The slide features a simple, bold "Thank You" text in the center-left, with a clean visual of a magnified osteoporotic bone on the right, providing a final visual anchor to the presentation's core topic.
Features of the Template
- 100% editable PowerPoint template.
- Editable colors, you can change according to your presentation style and company branding guidelines.