Peripheral Arterial Disease PowerPoint Template

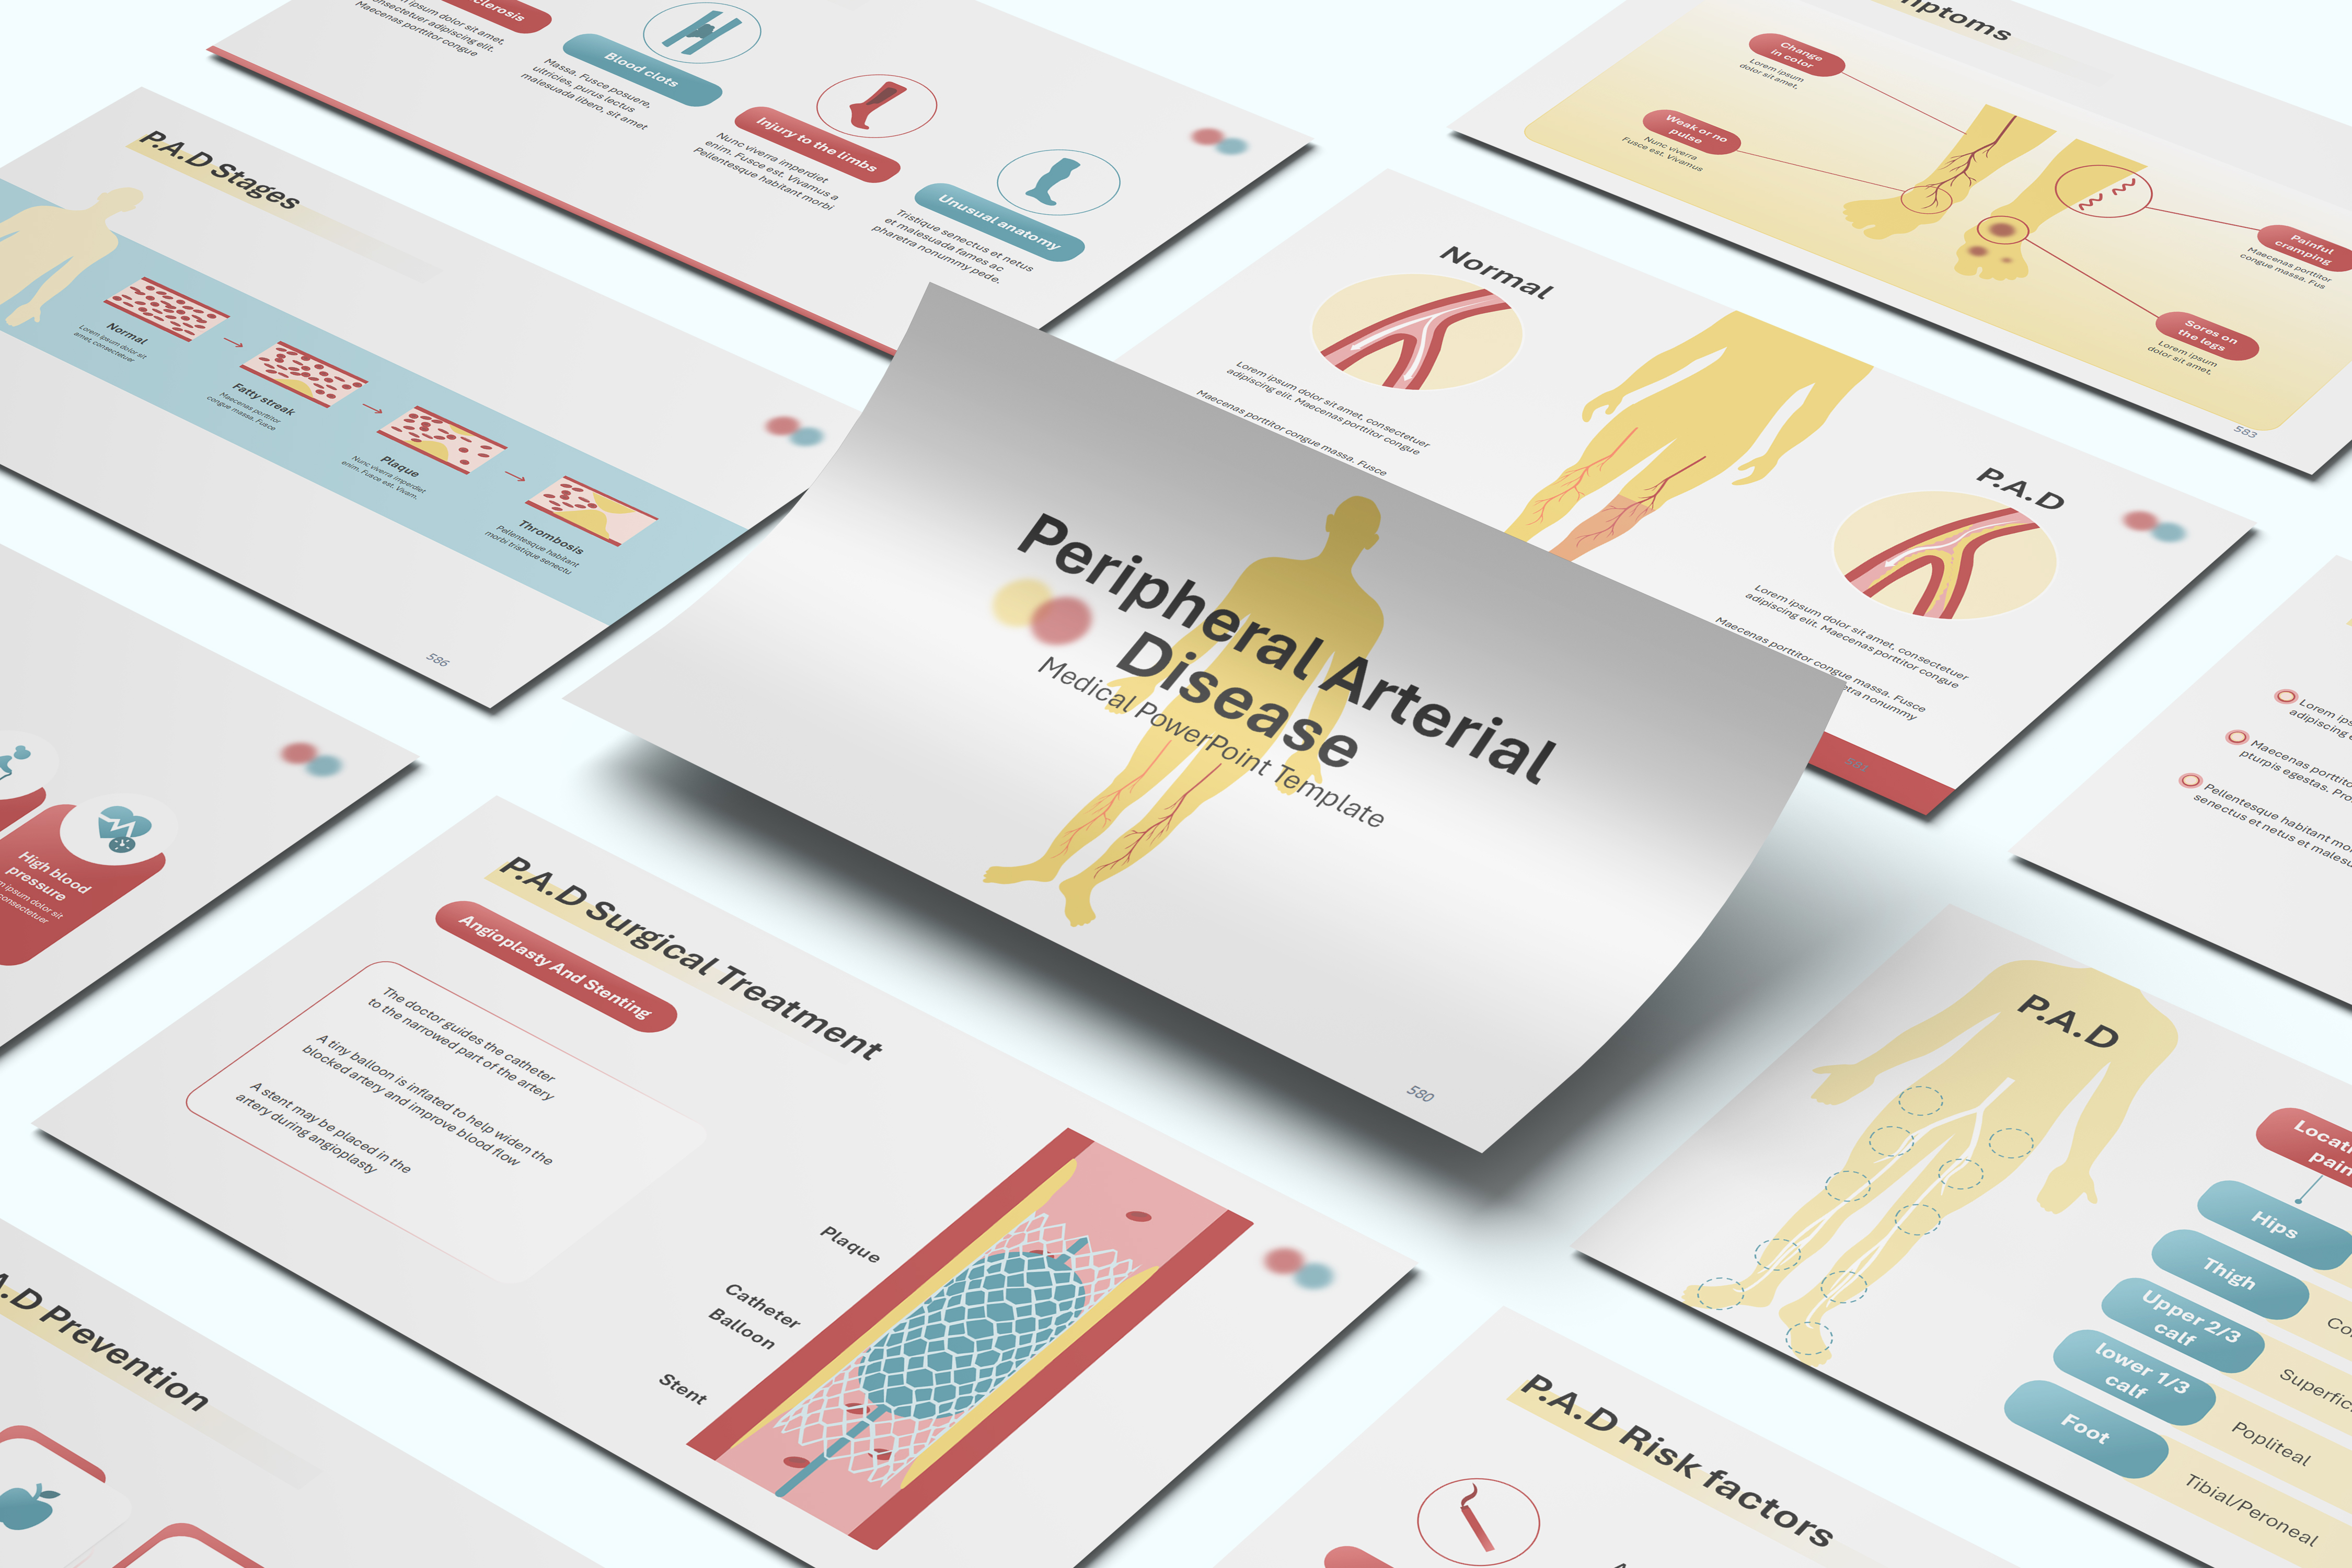




Template Preview
Designed for healthcare professionals creating clear and structured medical presentations.
Ideal for doctors, medical educators, and pharmaceutical teams preparing lectures, clinical education, product presentations, and training.
Fully editable in PowerPoint, allowing you to customize diagrams, charts, and slide layouts with your own medical content
Ready-to-use presentation structure that saves time and helps you build professional healthcare presentations quickly.
Fully Animated
Built-in animations help you present medical information clearly and make complex concepts easier to understand.
Editable Colors and Shapes
Editable colors and shapes help you easily customize the slides to match your content and presentation style, just drag and drop your content.
Professional medical layouts
Professional medical layouts help you organize clinical information, medical data, and treatment insights in a clear and structured way.

Created by Medical Professionals
This template prioritizes medical accuracy, clarity, and real-world usability. Each slide is designed with a medical audience in mind, helping you present clinical information, data, and treatment insights in a way that is structured, credible, and easy for healthcare professionals to understand.
Medical Training for Pharmaceutical & Life Sciences Companies
New cardiology and vascular sales hires can build their onboarding around this animated, 45-plus-slide Peripheral Arterial Disease template instead of piecing together artery illustrations from separate sources. Medical Affairs and Training teams walk trainees through the normal-versus-narrowed-artery comparison, the five-stage progression from endothelial dysfunction to plaque rupture with thrombosis, and a pain-location-to-artery correlation table that maps symptoms like hip, thigh, and calf pain to the specific vessel involved. Coverage extends through angioplasty, stenting, peripheral bypass surgery, and amputation, giving trainees a complete view of the treatment continuum before they support a vascular or cardiology portfolio in the field. New hires finish training able to connect a patient's symptom pattern to the underlying vascular anatomy.
Medical Congress & Scientific Conference Presentations
Vascular surgeons, cardiologists, and interventional radiologists preparing a symposium session on PAD can adapt this animated template's staged pathology sequence rather than commissioning new artery cross-sections for each talk. The pain-location-to-artery correlation table gives a speaker a ready teaching tool for connecting intermittent claudication patterns to specific vessels such as the popliteal or common femoral artery, useful in a case-based session. Diagnostic and procedural content covering ABI, duplex ultrasound, angioplasty, and bypass surgery supports a technically detailed discussion for a specialist audience. A Key Opinion Leader speaking at several vascular meetings can reuse the animated illustrations across sessions while swapping in institution-specific outcomes data.
Pharmaceutical Product & Medical Affairs Presentations
Medical Affairs teams supporting a cardiovascular or antiplatelet product can use this animated PAD presentation as neutral disease-state groundwork for scientific exchange, covering atherosclerosis pathophysiology, the staged progression to plaque rupture, and risk factors including smoking, diabetes, and hyperlipidemia. Medical Science Liaisons can deliver the customized material at advisory boards or KOL discussions to build shared clinical understanding before introducing any brand-specific safety or efficacy data. Because the presentation stays disease-focused, it functions as a starting point still subject to the customer's own compliance and medical review before any field use. Vascular and cardiology teams gain a consistent, animated scientific reference across multiple therapeutic conversations.
eLearning & SCORM Training Modules
Learning & Development teams training new vascular technologists or cardiology fellows can customize this animated PAD template with their own institutional protocols, then convert the finished presentation into a SCORM-compliant module for their learning management system when self-paced training fits the schedule better than a live session. The five-stage progression animation and procedural walkthroughs of angioplasty and bypass surgery translate naturally into interactive checkpoints within an e-learning course. When a program needs a narrower focus, such as diagnosis alone or a different depth for nursing versus physician assistant learners, the RxSlides team can adjust the template's scope and branding. For training needs that no existing template covers, the RxSlides team can also design a fully custom presentation from scratch to match the objective.
Medical & Healthcare Education
Medical and nursing faculty teaching vascular medicine can use this animated template's normal-versus-narrowed-artery illustrations to establish baseline anatomy before introducing pathology, rather than sourcing comparison diagrams from multiple textbooks. The pain-location-to-artery correlation table gives students a memorable framework for connecting a patient's reported symptom location to the specific vessel likely involved, a distinction that is often difficult to teach from text alone. Coverage of the five-stage disease progression and the full treatment spectrum, from lifestyle modification through amputation, supports a complete internal medicine or cardiology rotation discussion. Students leave with a structured understanding of how PAD symptoms map to underlying vascular anatomy.
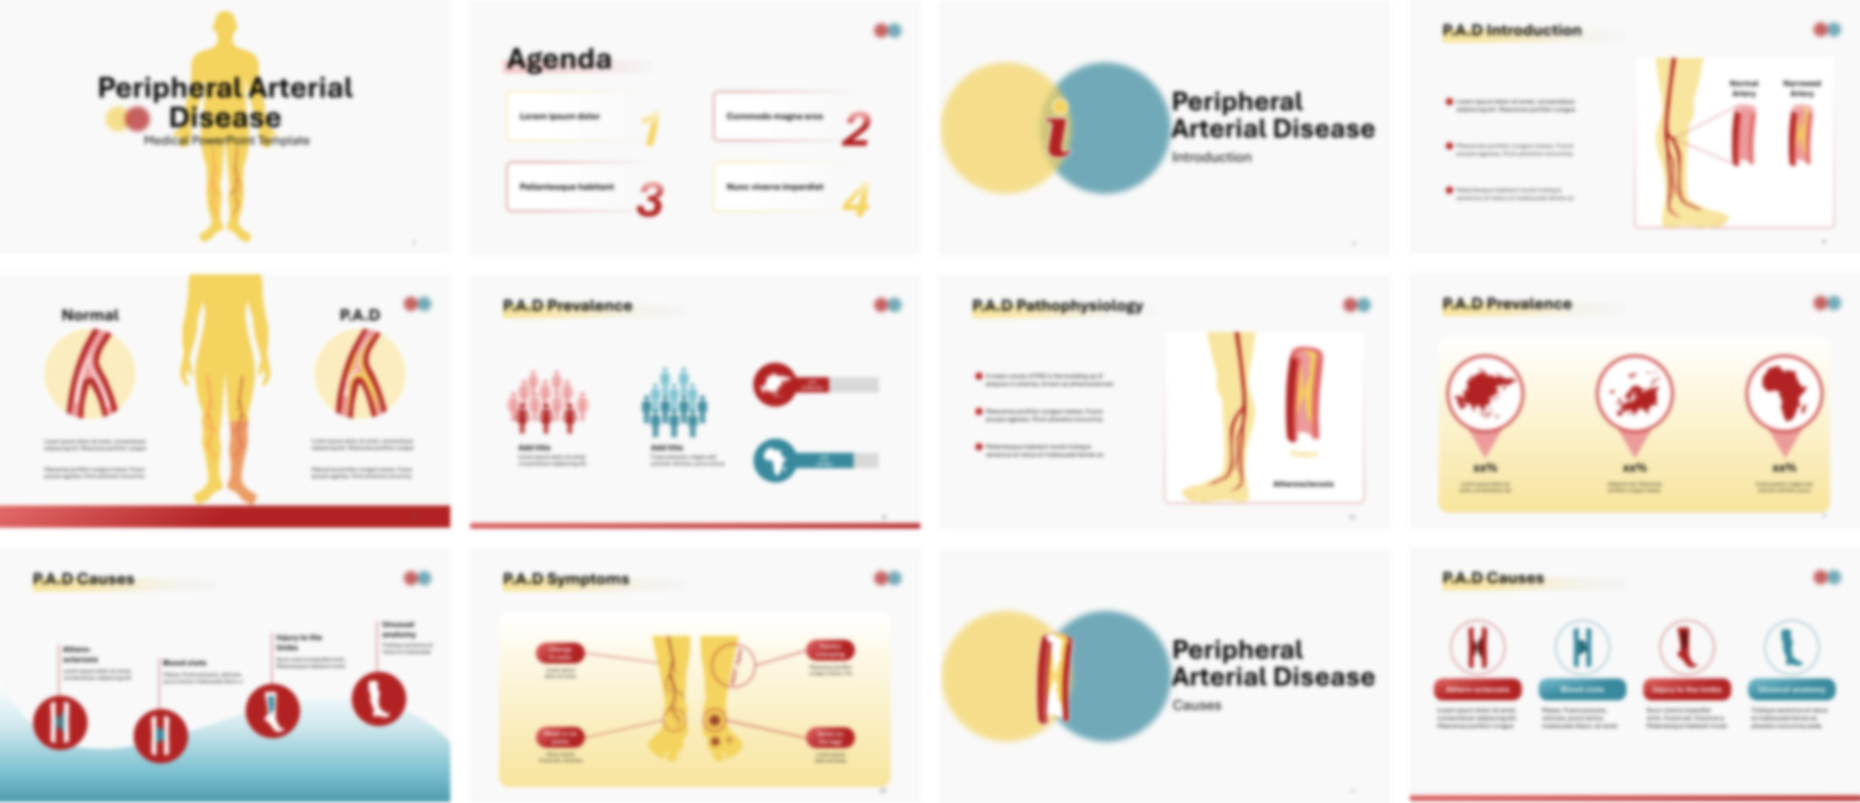
The Peripheral Arterial Disease PowerPoint template opens with a title slide contrasting a normal artery against a narrowed one in the lower leg before further illustrations compare healthy and diseased leg anatomy across the whole body. Circular callouts and gender based bar charts then present prevalence across global regions, providing a shared reference point for the sequence that follows in a set of editable PowerPoint slides.
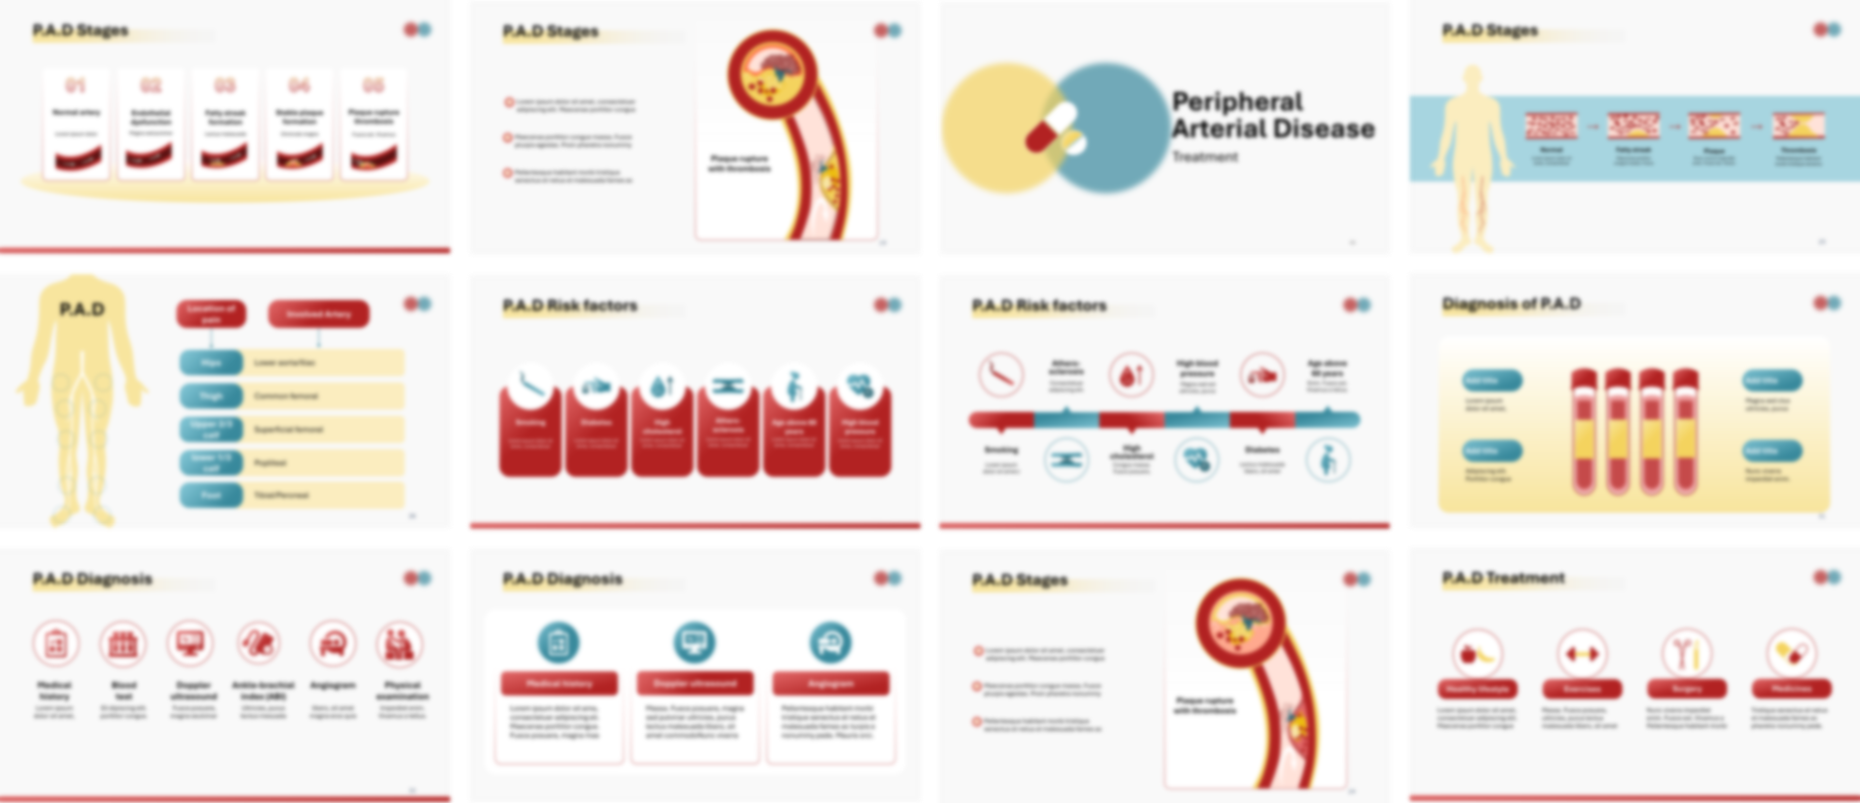
A visual locator connects the legs and feet to four key symptoms, change in color, painful cramping, weak or no pulse, and sores on the legs. The template then maps the correlation between the anatomical site of pain, including the hips, thigh, and calf, and the specific artery involved, from the common femoral to the popliteal and tibial arteries.
The presentation illustrates four causes, atherosclerosis, blood clots, limb injury, and unusual anatomy, before magnified cross sections explain the pathophysiology of plaque buildup and embolus formation that narrows the artery. Establishing this mechanism first gives educators a shared reference point before a five step progression stages the disease from a normal artery through endothelial dysfunction and fatty streak formation to plaque rupture with thrombosis.
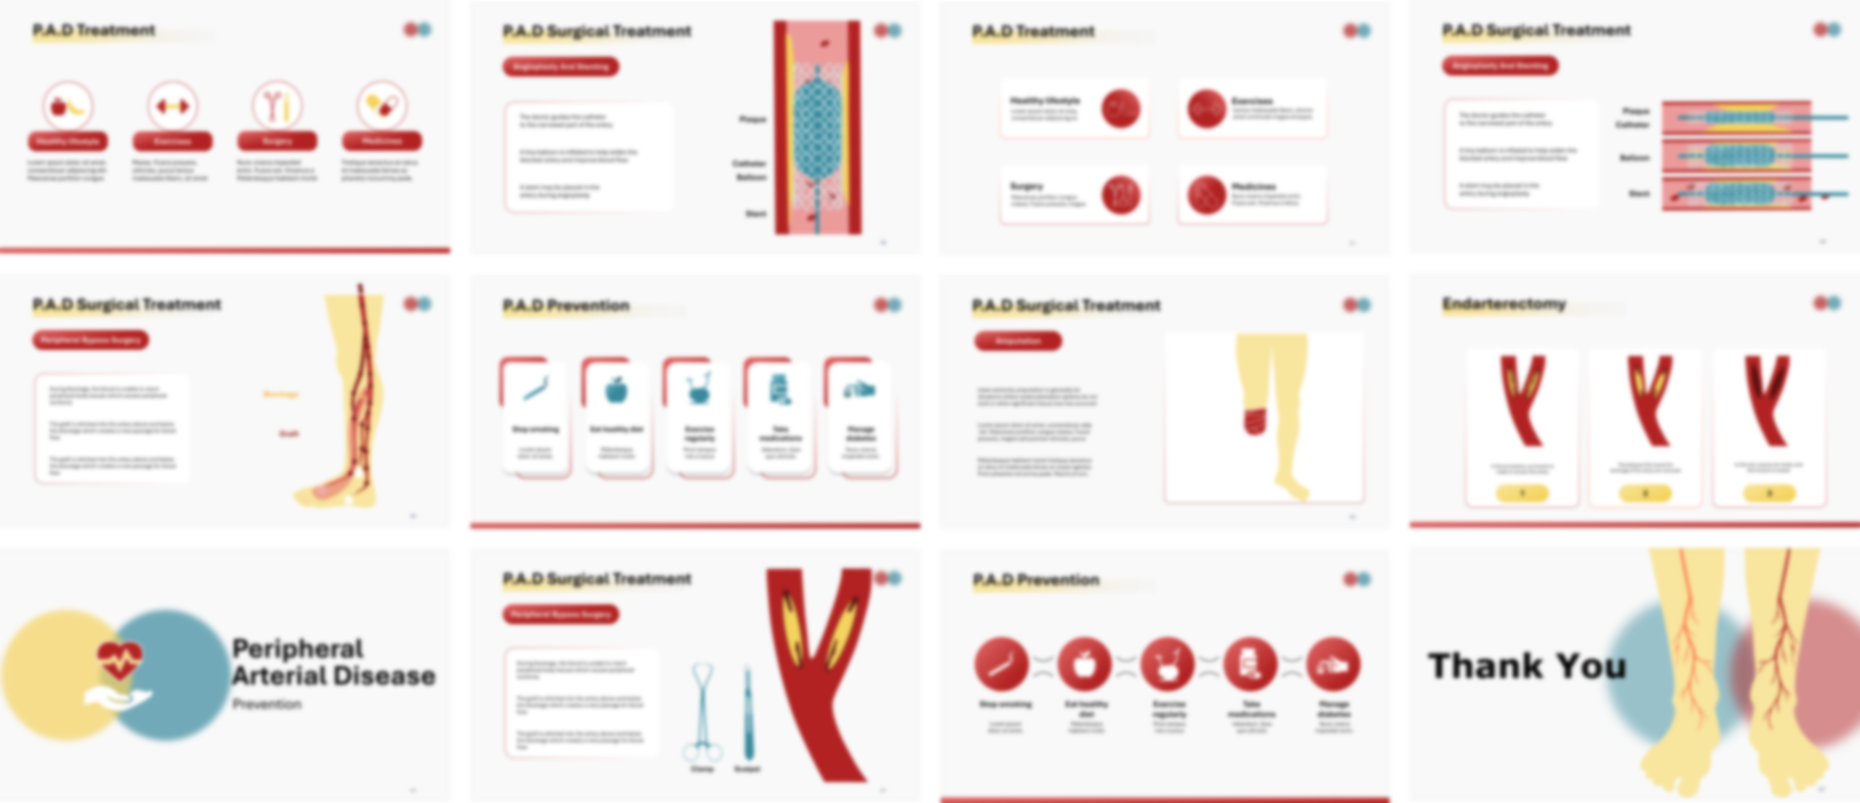
Medical icons cover six risk factors including smoking, diabetes, high cholesterol, and age above sixty before diagnostic slides detail six methods such as ankle brachial index, Doppler ultrasound, and angiogram. The presentation template closes with four treatment approaches, healthy lifestyle changes, exercise, surgery such as angioplasty and stenting or peripheral bypass, and medicines, alongside five preventive measures including smoking cessation and diabetes management in a set of editable medical diagrams.
Ready To Transform Your Presentation ?
Pay once, use forever